
Abstract
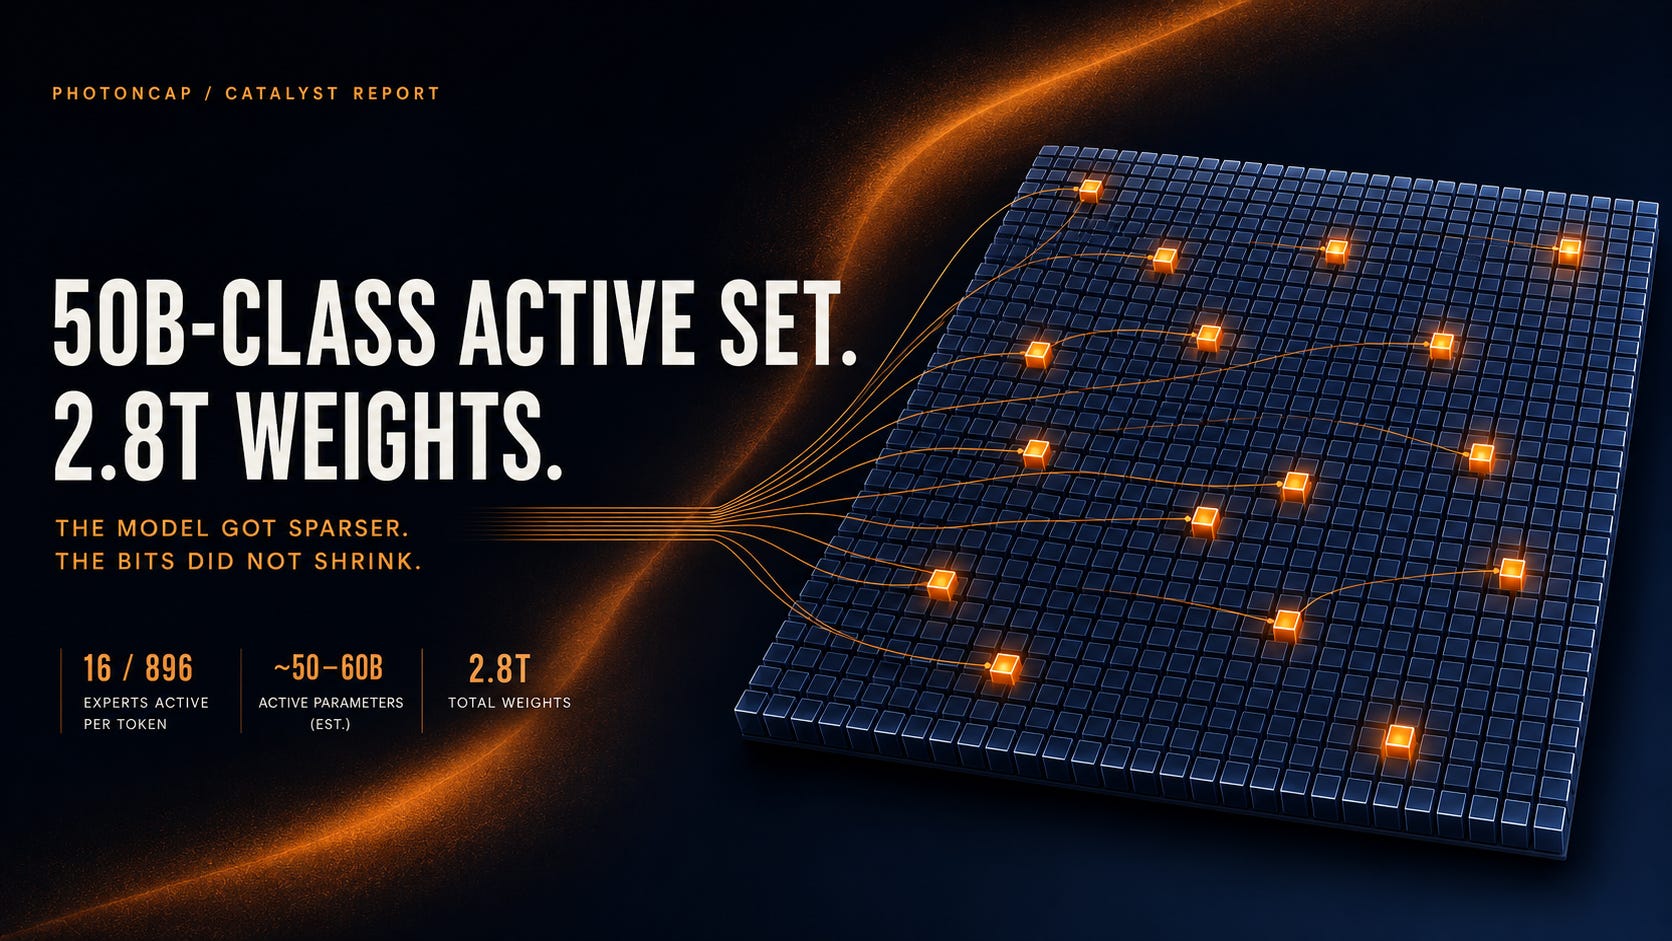
Kimi K3, released July 16, is a 2.8 trillion parameter MoE model that activates 16 of 896 experts per token. Its active parameter count is estimated at roughly 50 to 60B (unofficial estimate, technical report not yet published). The trading day after TSMC reported a 77.4% jump in quarterly net income, its Taiwan-listed shares fell 7.3% and the US ADR $TSM fell 2.8%. K3 was less the sole cause of that selloff than a catalyst that amplified AI capex caution already in place. This article works through three calculations from K3’s spec: the memory its weights require (a theoretical floor of about 1.4TB at MXFP4), a KV cache baseline for its 1M token context, and the widening gap in large open-weight MoE models, where total parameters grew about 4x in 19 months while active parameters grew around 1.4x. The conclusion the public spec supports: K3 cuts per-token compute while raising memory and communication load at the same time. The article then maps that load to five supply chain exposure points: die, package, rack, campus, and test. This article is fully free.
Data cutoff: July 20, 2026. K3’s API and architecture overview are public, but the full weights and technical report are not yet released. Some figures, including the 50 to 60B active parameter count and the actual serving footprint, are independent estimates. Moonshot has stated the full weights will be released by July 27. License terms and exact configuration will be updated here once they are public.
Net Income Up 77.4%. The Next Trading Day, Down 7.3%
The trading day after reporting a 77.4% year-over-year jump in quarterly net income [1], a company’s shares fell 7.3% on the Taiwan exchange. That company was TSMC [2]. The same day, the US ADR $TSM fell 2.8% (NYSE close, 2026-07-17), SoftBank dropped 9%, the Nasdaq 100 slipped 1% intraday, and NVIDIA ($NVDA) briefly handed the largest market cap spot to Apple during the session [3].
No single cause explains that selloff. Caution around AI capex and valuations had been building for a while, and the earnings themselves, strong as they were, left cost concerns on the table [2]. But there is little disagreement that Kimi K3, the open model Moonshot AI released on July 16, was the catalyst that amplified it.
The catalyst’s logic is simple: if a frontier-class model becomes available through a low-cost API or downloadable open weights, the case for hardware spending appears to weaken. It is a familiar argument. The same selloff played out in January 2025 with DeepSeek.
And we already know how that experiment ended.
Summary: the logic behind the K3 correction is a rerun of the DeepSeek shock. That experiment already produced a result once.
The Experiment We Already Ran in January 2025
The selloff logic during the DeepSeek shock was “cheaper models mean lower infrastructure spending.” That equation never showed up in hyperscaler capex guidance afterward. You cannot claim the price drop directly caused spending to rise, but the direction was, at minimum, not the one the selloff priced in. What got cheaper was the model, not the infrastructure that runs it.
There is already a framework piece that organizes this structure: Damnang’s analysis of open models and semiconductor demand. Its conclusion, in one line: open models do not shrink the hardware market. What gets compressed is the frontier model developer’s premium, and value moves toward hyperscalers and the semiconductor infrastructure underneath them.

This article takes that frame as given. What it adds is a different question, worked out in numbers. What does one model like K3 physically require, and how much? And if models like this keep coming, where in the supply chain does that requirement land?
First, let’s separate what the official spec confirms from what is still an estimate.
Calculation 1: 1.4TB of Weights, and That Is the Floor
Here is what Moonshot’s official material confirms: 2.8 trillion total parameters, 16 of 896 experts activated per token, a 1 million token context window, and quantization-aware training from the SFT stage using MXFP4 weights with MXFP8 activations [4]. The active parameter count per token is not in the official material. Ken Huang estimates it at roughly 50 to 60B [8]. A simple 2.8T x 16/896 calculation produces about 50B, but that arithmetic assumes the parameters are spread uniformly across routed experts. In reality the 2.8T total also includes always-active attention, embeddings, routing, and shared components, so the correct expression is common parameters plus 16/896 of the routed-expert parameters. Because Moonshot has not disclosed the split between common and routed-expert parameters, the exact active count cannot yet be calculated from the official specification (unofficial external estimate).
Start with the memory the weights require. A naive conversion at 4 bits per parameter gives 2.8T x 0.5 bytes = about 1.4TB. That number is not a conservative estimate. It is a theoretical floor: raw payload with scale metadata, alignment, and communication buffers stripped out. The actual serving footprint is larger. At FP8-class precision, the figure is 2.8TB.
Put that against the nominal capacity of the current top accelerator and the scale becomes visible. NVIDIA’s Blackwell Ultra (B300/GB300) carries 288GB of HBM3E per GPU [7]. Dividing nominal capacity alone, 1.4TB is 5 GPUs’ worth and 2.8TB is 10. That is not a minimum deployment count. KV cache, activations, and parallelism overhead stack on top, and as we will see, Moonshot itself recommends a much larger configuration. Scaled to a GB300 NVL72 rack of 72 GPUs, nominal rack HBM is 72 x 288GB = about 20.7TB [7], and one copy of K3’s FP8-class weights occupies more than 13% of it as a resident.
Compare with the previous generation and the slope shows. Kimi K2 was 1.04 trillion total parameters [5]. Total parameter count grew 2.7x in twelve months.
This article’s title comes from here. The routed experts selected per token are 16 of 896, a ratio of 1.8% [4]. That ratio does not equal 1.8% of total FLOPs. Attention, the router, and shared paths keep their own compute. But the structure is clear. The model limits the active parameter set to an estimated 50 to 60B per token, yet because the router can call any expert on the next token, a high-throughput serving system needs all 2.8T weights reachable at low latency, in accelerator memory or a tier close to it. Offloading or caching some experts elsewhere is possible. The price is latency and throughput.
A library analogy helps. Active parameters are the books open on the desk for this one token. Resident weights are every book that has to stay on the shelves. Only 16 of the 896 librarians are working, but since nobody knows which one the next visitor will ask for, all of them have to sit in the waiting room. Compute cost tracks the 16 at work. Memory cost tracks the size of the room.
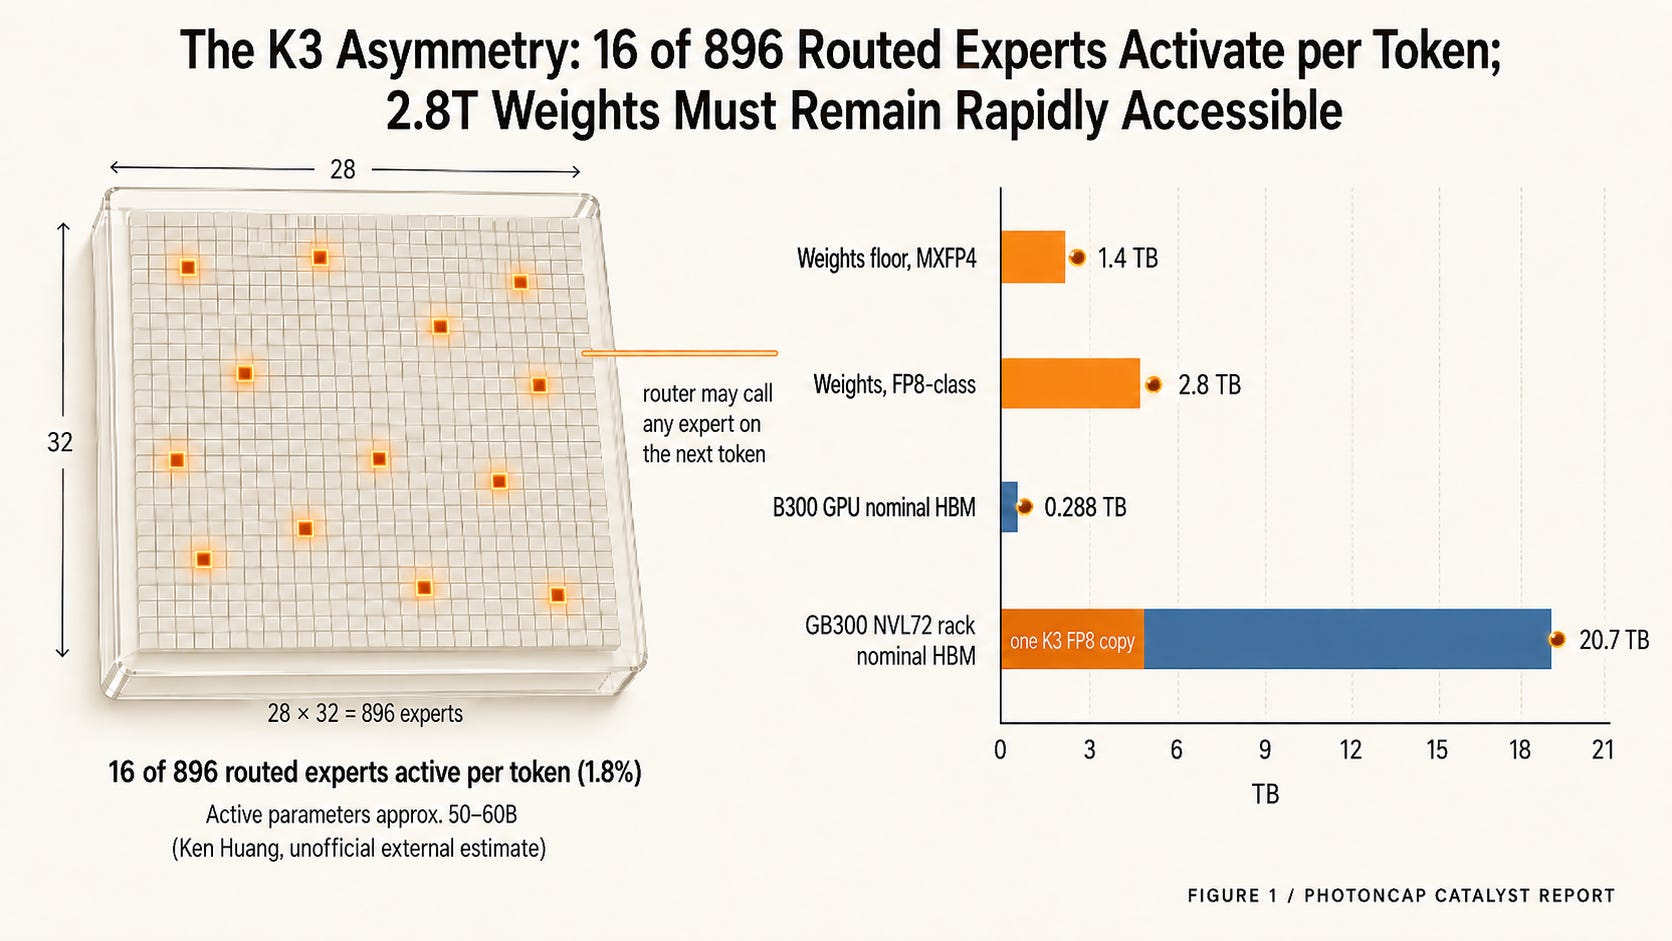
Figure 1: The K3 asymmetry, 16 of 896 routed experts activate per token while the full 2.8T parameter set must remain rapidly accessible
Investment read: 16-of-896 routing sparsity limits the active parameters per token, but the serving system still needs low-latency access to all 2.8T weights. With actives growing far more slowly than totals, the bottleneck’s center of gravity expands from compute alone into a system problem spanning memory capacity, bandwidth, and interconnect.
Weights, though, are half the serving memory story. The other half is created not by the model but by usage.
Calculation 2: KV Cache, the Second Memory That Usage Creates
K3’s context window is one million tokens [4]. Context carries a memory cost: the KV cache, which stores the attention keys and values of every token the model has read.
One thing to be clear about first. The calculation below is not K3’s actual KV memory. It is a counterfactual baseline: what K3 would look like if it were a standard GQA attention model. In a standard architecture, KV cache size is roughly 2 (K and V) x layers x KV heads x head dimension x context length x precision. Assume a typical frontier-scale configuration (author estimate: 60 layers, 8 GQA KV heads, head dimension 128, FP8) and a single 1M token session comes to about 123GB. That is over 40% of one B300’s nominal HBM, occupied by a single user’s conversation.
K3’s actual memory requirement is likely lower than this standard-GQA baseline. K3 is a hybrid attention design combining KDA (Kimi Delta Attention) with Gated MLA, and KDA exists precisely to cut this cost [4]. The size of the reduction cannot be calculated until the layer mix and state structure are disclosed.
Line up what the labs chose and the direction converges. DeepSeek compressed the KV cache with MLA [6]. Moonshot rebuilt attention itself with KDA. MoE sparsity cuts per-token compute, and MXFP4 quantization-aware training cuts bits per parameter [4]. Nearly every frontier architecture improvement of the past two years points the same way: not adding FLOPs, saving bits. Watch where the labs concentrate their engineering and you can read where the bottleneck sits.
KV has one more property that weights do not. Weights are a fixed cost per serving replica. KV and state are a variable cost that grows with active sessions and context length. They scale with usage, not with the number of models. The pattern so far: each time compression lowered the per-session cost, longer contexts and more concurrent sessions filled the space it opened. There is no guarantee the pattern holds. But what happened right after K3’s launch, as we will see below, was at least not the opposite.
Summary: under a standard GQA counterfactual, one 1M token session is about 123GB (author estimate). K3’s actual figure is likely lower, but the reduction cannot yet be quantified. Still, the fact that architecture work keeps converging on memory tells you where the bottleneck sits.
Calculation 3: Totals Grew 4x. Actives Grew About 1.4x
How many more models like this are coming? The sample here is not all open models. It is the largest open-weight MoE snapshot at each point in time. Dense models and small MoE are not in this sample.
December 2024, DeepSeek-V3: 671B total, 37B active, a 5.5% activation ratio [6]. July 2025, Kimi K2: 1.04T total, 32B active, 3.1% [5]. July 2026, the same weekend Moonshot shipped K3 at 2.8T, Alibaba introduced its 2.4 trillion parameter Qwen3.8-Max-Preview with an open-weight release planned [9]. Take K3’s active parameters at Ken Huang’s 50 to 60B estimate [8] and its activation ratio is 1.8 to 2.1%.
Over 19 months, total parameters grew 4.2x while active parameters grew 1.35 to 1.62x on the estimate range. The activation ratio walked down from 5.5% to 3.1% to around 2%. Back in the library, the shelves grew 4.2x over 19 months while the librarians on duty grew about 1.4x. Each generation grows the active parameter set far more slowly than the total parameter count, while the parameter set that must remain reachable keeps growing. This gap is the most important chart in this article.
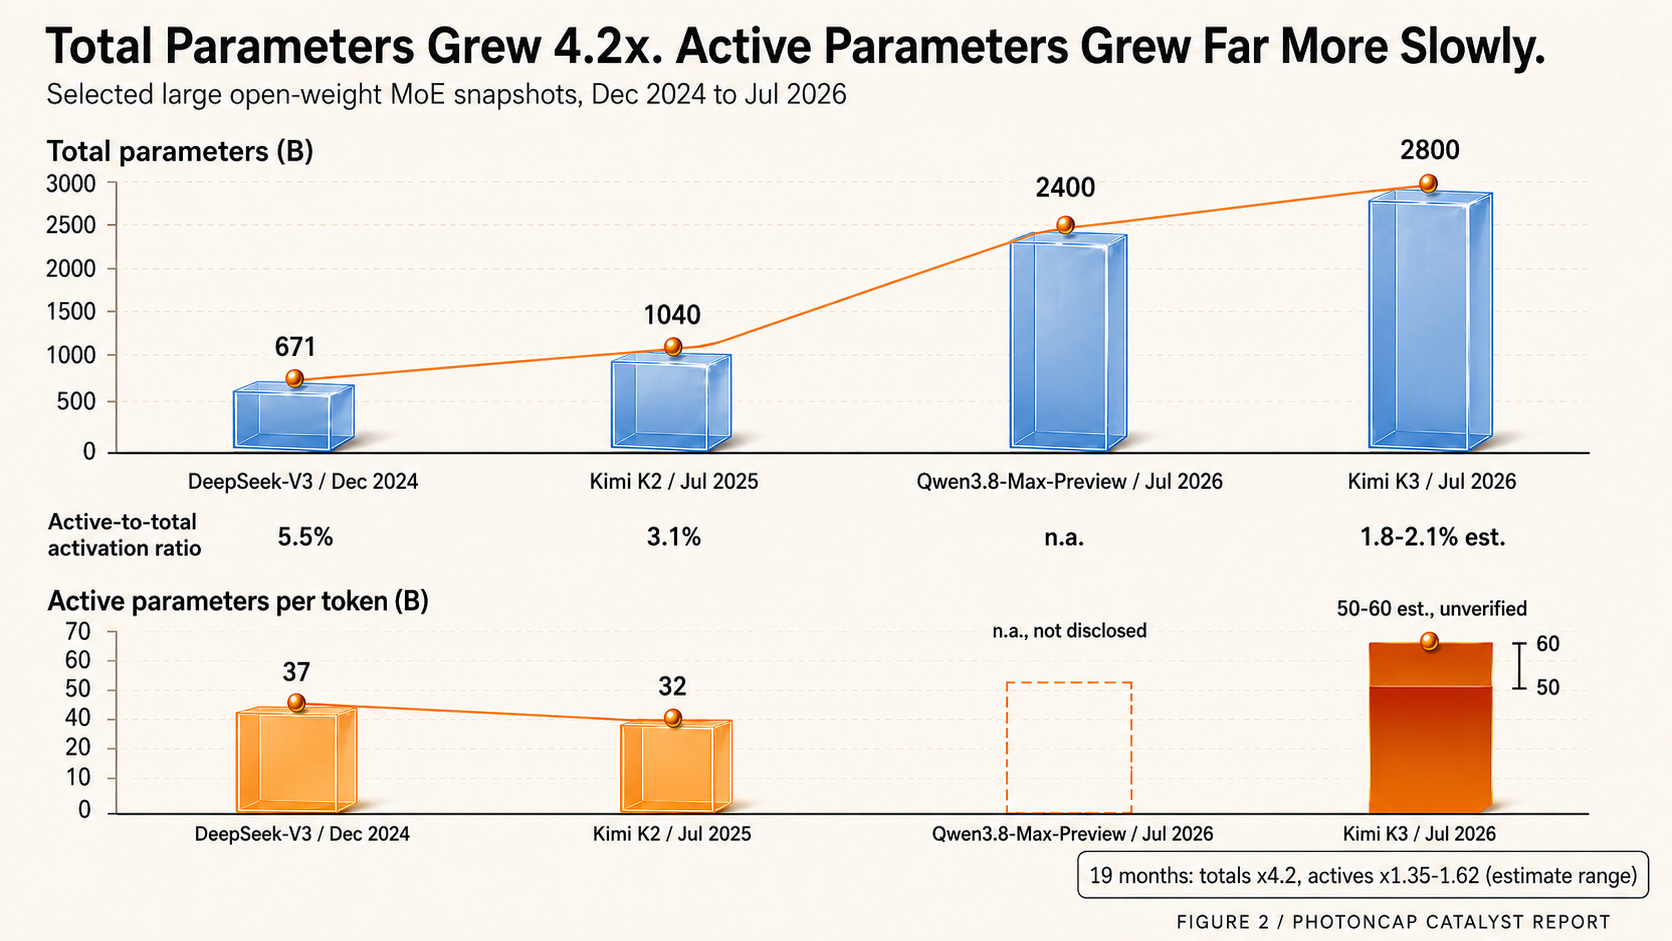
Figure 2: Total vs active parameters, selected large open-weight MoE snapshots, Dec 2024 to Jul 2026
Three forces push the trend: compute constraints, competitive density, and self-hosting.
Compute constraints first. Sparsity is the cheapest way to scale model size in a compute-scarce environment. Reuters notes that US export controls have made access to computing power a key constraint for China’s AI developers [9]. When FLOPs are hard to secure, a sparse MoE that runs a bigger model on the same compute is less a choice than a forced direction. What the controls aimed to block and where demand actually grew sit in different places. Squeeze the compute, and the architecture grows toward memory.
Competitive density. It is no accident that Alibaba shipped a 2.4T model the same weekend K3 arrived [9]. Everyone from the large platforms down to startups like DeepSeek and MiniMax is in the same race [3], and a race on total scale has no incentive to stop.
Self-hosting. Moonshot has stated the full weights will be released by July 27 [4]. There is no official license announcement yet, so the actual self-hosting terms need confirming after release. If the weights land as planned, the serving infrastructure demand that has so far lived inside frontier labs gets recreated in enterprises, governments, and sovereign clouds. Everything that closes the gap between “can download a 1.4TB model” and “can run it” is hardware spending.
And just before this article went out, the most direct data point on this logic arrived. On July 19, Moonshot paused new subscriptions, saying K3 demand had approached the limits of its existing clusters within 48 hours, and allocated available compute to existing paid users [9]. A signal pointing in the exact opposite direction of “cheap open models reduce infrastructure demand,” and it came from the company that built the model.
Summary: totals up 4.2x, actives up around 1.4x. As long as that gap holds, incremental demand shifts disproportionately toward memory capacity, bandwidth, and interconnect. Not away from compute, but beyond compute alone. And the company that built the model paused new consumer subscriptions over capacity constraints three days after launch.
Where the Bottleneck Shows Up: Die to Test
Break this demand down by supply chain exposure point and five layers remain. This is an exposure map, not a time sequence. Capacity reservations, HBM production, rack networking, DCI, and test equipment orders all move in parallel, each on its own lead time. PhotonCap has covered each layer separately, so each one links to the relevant analysis.
1. Die: foundry capacity. More resident bits mean more wafers for the DRAM dies and the base and logic dies under every HBM stack, and as optical interconnect moves into the package, dedicated silicon photonics capacity. Capacity is a resource with lead times measured in years, so the land grab starts before the bottleneck makes headlines. What happened at the foundries before the laser shortage became news: Everyone Saw a Laser Shortage. The Money Went to the Foundries First.
2. Package: HBM. As K3’s arithmetic shows, the variable is not price per bit but total bits shipped. And the memory wall is not only a capacity problem. Bandwidth, latency, and the energy cost of moving those bits can constrain serving economics even when nominal capacity is enough, which is why growing capacity and growing bandwidth pull on different supply chains. Why HBM demand and optical memory pooling diverge: The More Anthropic Buys Micron HBM, the Faster Optical Memory Pooling Arrives
3. Rack: scale-up interconnect and InP. With 896 experts split across accelerators, the router’s per-token expert calls generate traffic between accelerators. Moonshot itself recommends deploying K3 on supernodes of 64 or more accelerators, noting that inference efficiency benefits from larger high-bandwidth communication domains [4]. That is a structure where scale-up domain bandwidth decides serving economics. Optics enters at the distances copper cannot reach, and the more optics wins, the more InP sells: The More Silicon Wins, the More InP Sells
4. Campus: coherent DCI. If self-hosting and inference diffusion actually spread across multiple sites, traffic between sites grows with them. Self-hosting that stays inside a single datacenter or a single cloud gives this layer limited benefit. The switch that turns this layer on is multi-site distribution. Why scale-across is a different market with a different frame: One Layer Below SemiAnalysis’s Meta Map
5. Cross-cutting: test and measurement. Test is not a final step. It runs across wafer, die, package, module, and link manufacturing at the same time. Whoever wins the four layers above, every new HBM stack and every new optical link ships only after it passes test: Compute Is the New Oil. So Who Builds the Drilling Rigs?
Investment read: the five layers are parallel exposures, not a sequence. The land grab shows first where lead times are longest (foundry capacity), and volume shows first where demand tracks usage directly (HBM, scale-up optics).
Closing: The Two Things This Correction Is Discounting Together
Damnang explains why open models do not destroy semiconductor demand. Kimi K3 shows, in its spec, where that demand goes. A structure that limits the active parameter set to an estimated 50 to 60B per token while requiring access to 2.8T weights. A total-versus-active gap that widens every generation. And a capacity shortage notice three days after launch.
The conditions that would weaken this picture belong on the record too. Expert offloading and caching working better than expected, reducing what must sit in accelerator memory. Another step up in quantization density. Self-hosting delayed by concentration in cloud APIs. KDA-class architectures cutting far deeper against the baseline than assumed. The breakdown of K3-driven demand into listed-company exposure across HBM, InP light sources, coherent DCI, and test equipment, along with the indicators to watch for each, continues in the four pieces linked above.
Even granting those conditions, this correction is discounting the model layer’s premium compression and the demand for HBM, optical interconnect, and foundry capacity at the same multiple. I do not think those two point the same way.
The fiercer the competition gets at the model layer, the more the hardware layer sells to whoever wins.
Acknowledgment
This article’s starting point is Damnang’s analysis of open models and semiconductor demand.
References & Sources
[1] TSMC, “TSMC Reports Second Quarter EPS of NT$27.25”, Jul 16, 2026.
[2] Bloomberg, “Chip Stock Rout Deepens as TSMC Selloff Drives Taiwan Correction”, Jul 17, 2026.
[3] Fortune, “Markets experience new DeepSeek shock after Moonshot AI releases Kimi K3”, Jul 17, 2026.
[4] Moonshot AI, “Kimi K3: Open Frontier Intelligence”, Jul 16, 2026.
[5] Moonshot AI, “Kimi K2: Open Agentic Intelligence”, arXiv:2507.20534, first submitted Jul 2025.
[6] DeepSeek-AI, “DeepSeek-V3 Technical Report”, arXiv:2412.19437, Dec 2024.
[7] NVIDIA, “Inside NVIDIA Blackwell Ultra: The Chip Powering the AI Factory Era”, NVIDIA Developer Blog, 2025.
[8] Ken Huang, “Demystifying Kimi K3: The Three Algorithms Behind the #1 Frontend Coding Model”, Substack, Jul 18, 2026.
[9] Reuters, “China’s Moonshot pauses Kimi subscriptions amid hot demand, IPO push”, Jul 20, 2026.
Useful?
share it
Disclaimer: This article is an independent, engineering-driven technical analysis published by PhotonCap. All content is based on publicly available information and is intended for educational and informational purposes only. Nothing herein constitutes a recommendation to buy, sell, or hold any security. The author may hold positions in securities discussed and may transact at any time without notice. Readers should conduct their own due diligence before making any investment decisions.
This is an unusually valuable analysis because it shows why a cheaper open-weight model does not necessarily reduce hardware demand. K3 economizes on active compute by routing each token through only a small group of experts, but the full 2.8 trillion parameter set still has to remain rapidly accessible. The savings occur in FLOPs; the pressure shifts toward HBM capacity, bandwidth, and interconnect.
The widening gap between total and active parameters may be the most important signal here. If model size continues expanding much faster than the number of parameters activated per token, then architecture is not eliminating the infrastructure requirement. It is redistributing that requirement across memory, racks, networking, foundries, packaging, and test. K3 reaching Moonshot’s capacity limit within days seems like real-world confirmation of that direction.
The unresolved question may therefore sit less with the hardware vendors than with the hyperscalers financing the buildout. They either see credible paths toward profitable AI revenue that remain difficult for outside investors to measure, or competition and network effects are compelling them to continue investing before the final revenue model is clear.
Given how early this development remains—and how AI may eventually combine with adjacent technologies such as optimization, robotics, and quantum computing—I wonder whether hyperscalers view the present uncertainty as a reason to slow down, or as the very reason they cannot afford to fall behind.
The market may continue producing corrections whenever investors question the eventual returns. But your analysis suggests those corrections are discounting pressure on the model layer and demand growth in the hardware layer as though they were the same thing, when they may point in opposite directions.