
Abstract
It is already early August, but to look back and think about AI infrastructure investment and the outlook going forward, I went through the hyperscaler earnings from the last week of July, pulled together commentary from various outlets and X, and prepared my own opinion and analysis alongside it. Alphabet, Microsoft, Amazon, and Meta earnings were all packed into the last week of July. I started writing this piece after seeing the Google Cloud +82% number, and as I wrote, it seems half of the piece turned into checking the underearning story Gavin Baker raised first, that is, the observation that GPU spot rental prices are more than 2x contracted prices, against this quarter’s results. The other half is redrawing and checking the cloud capex hardware map I drew in May with data one quarter later. To note just the direction up front, I see this quarter as the early stage where the supply shortage starts getting reflected in prices, and I suspect the place where that money stays longest is the two layers hyperscalers cannot insource.
Contents
Backlog at $514B, but the Stock Fell
When the Lease Runs Out: Baker’s Underearning Thesis
The Four Hyperscalers’ Results: The Numbers
The Boundary Public Materials Can Show
Primary Evidence of Repricing: Usage Above Commitments and Backlog Quality
The Meta Compute Variable
May Map Update: Allocation Tilting Toward L3 and L4
As Efficiency Improves, the Bill Grows
Conclusion, and the Conditions Under Which I’m Wrong
1. Backlog at $514B, but the Stock Fell
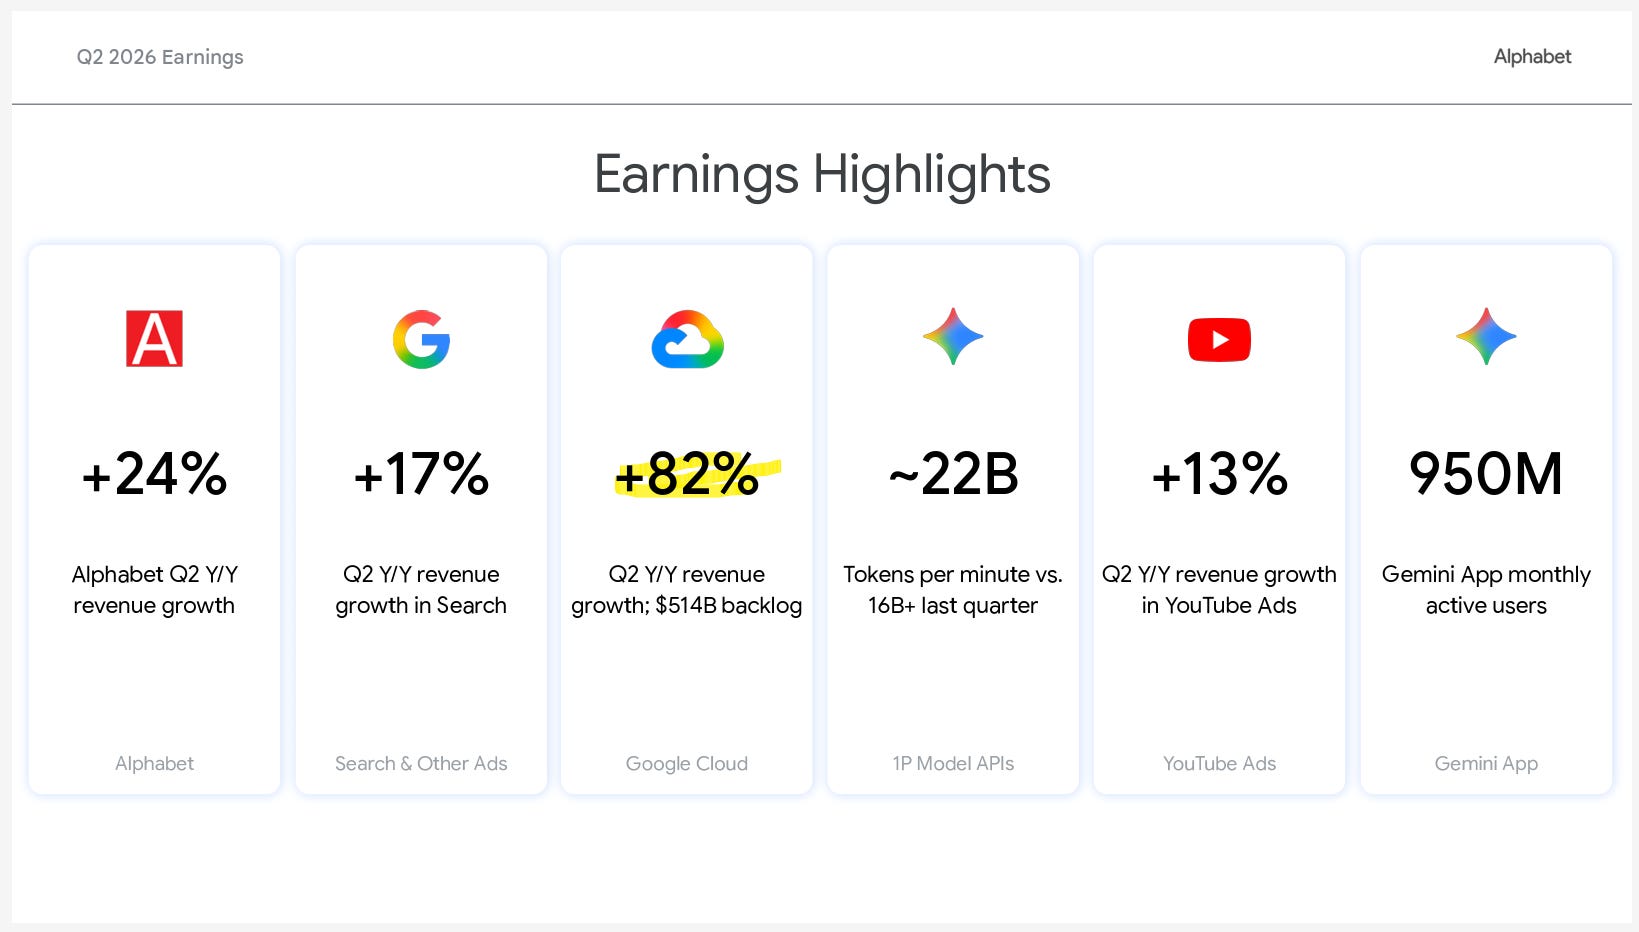
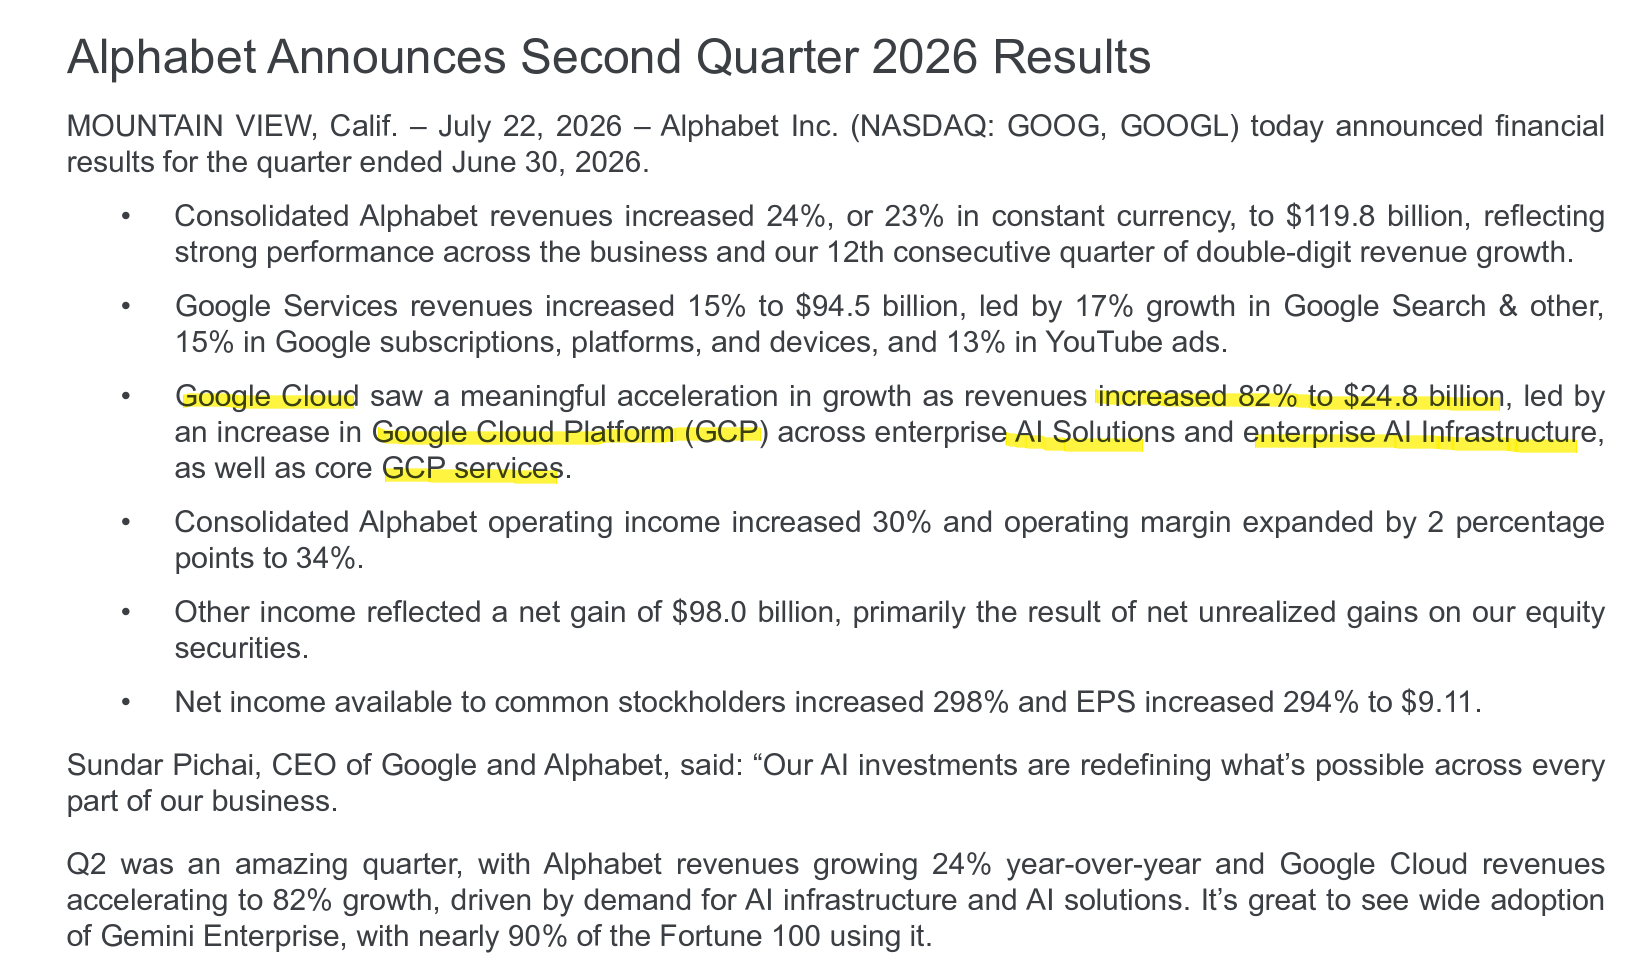
In Alphabet’s July 22 earnings, Google Cloud revenue was $24.77B, up +82% year over year [1]. The prior quarter’s growth rate was +63%, so it got even steeper in a single quarter. A company this large accelerating its revenue growth struck me as worth paying attention to. The backlog, contracted but not yet recognized as revenue, stands at $514B, up more than $50B in one quarter [1]. And yet the stock reacted to the earnings release by falling. The company raised capex guidance again, and quarterly free cash flow flipped negative [1].
To borrow the news framing, the books and the stock went in opposite directions.
This combination is the key question of this earnings season. Record demand is piling up on the books, while the market looks first at “the cash being burned to serve that demand.” Which of the two is the right lens?
So the points I want to discuss in this piece come down to two. One is whether the underearning thesis, that hyperscalers are currently selling compute below market rates, is supported by actual earnings data. The other is, if so, which hardware layer the growing cash flow and capex flow into.
2. When the Lease Runs Out: Baker’s Underearning Thesis
The starting point of this piece is the argument Gavin Baker of Atreides Management laid out in a recent X post and in his Invest Like the Best interview back in May [2][3][4]. The problem statement is his, and in this piece I put my own thinking alongside it and check that argument against this quarter’s primary data.


“TL;DR Spot pricing for renting GPU compute materially above contracted rates implies hyperscalers are underearning while operating cash flow acceleration is an underestimated source of funds for AI capex.”
…
“As contracts roll-off, hyperscale growth rates are going to continue to accelerate as their installed bases of compute reprice higher.”
…
“Hyperscalers are underearning and anyone who signed a contract for GPU compute in 2024 and 2025 is overearning. Operating cash flow will be enough to fund capex but as contracts reprice and cloud growth continues to accelerate then spreads likely come in as well.”
The market may be overreacting to widening hyperscaler credit spreads.If spot GPU rental prices are at least twice contracted rates, hyperscalers are likely underearning relative to the current value of their installed compute. As older contracts roll off and reprice higher, cloud revenue and operating cash flow could accelerate faster than consensus expects, allowing a much larger portion of future AI capex to be funded internally rather than through debt.
• Customers that locked in GPU compute during 2024 and 2025 are currently overearning
• Contract repricing could reaccelerate hyperscaler growth and operating cash flow
• The real constraint may be power and data-center execution, not access to creditThe more important question may not be whether hyperscalers can finance AI infrastructure, but how quickly they can energize the GPUs and convert that capacity into revenue.
The argument goes like this. The price of renting GPU compute on the spot market, that is, on demand without a contract, is at least 2x the long-term contracted price [2]. Since most hyperscaler revenue comes from long-term contracts signed some time ago, they are effectively selling compute for less than half of what they could charge at today’s rates. Baker calls this underearning, meaning earning less than they could.
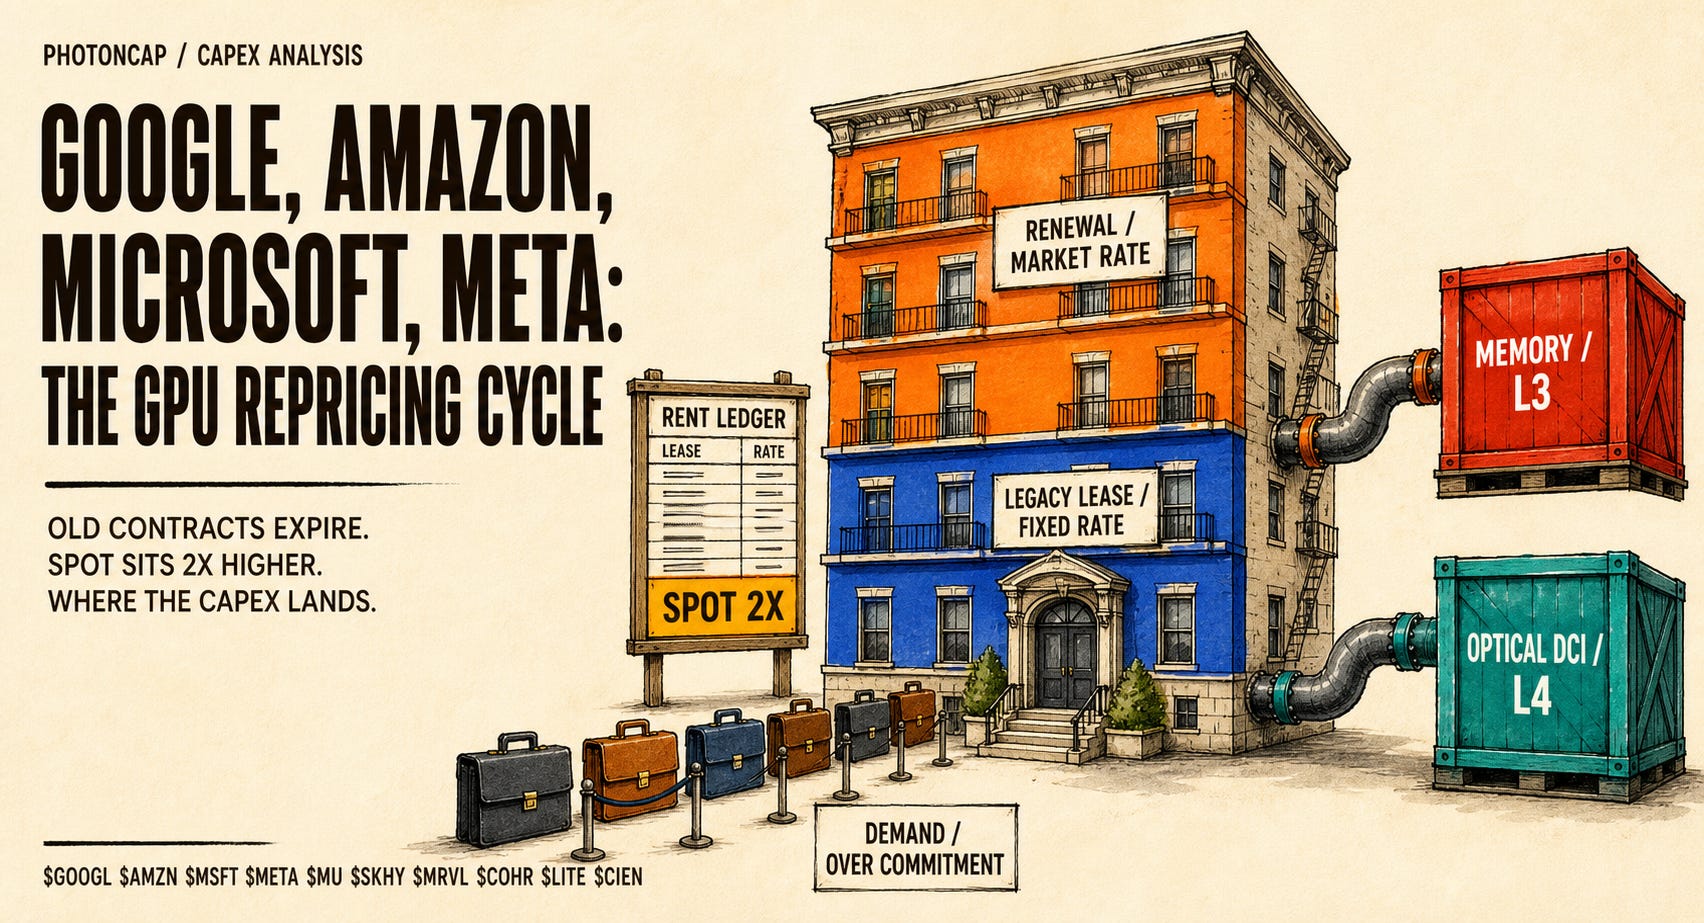
Think of a rent-stabilized apartment and the structure clicks. During the lease term, no matter how much market rent rises, what the landlord collects is fixed. If market rent doubles, the landlord gets upset, but there is nothing they can do until the lease ends. Instead, when renewal time comes, the accumulated rise in market rates gets reflected all at once. Or the landlord is expected to raise the price. Baker’s claim is that hyperscalers are now landlords sitting on rent-stabilized leases, and the renewal cycle has slowly started to come around.
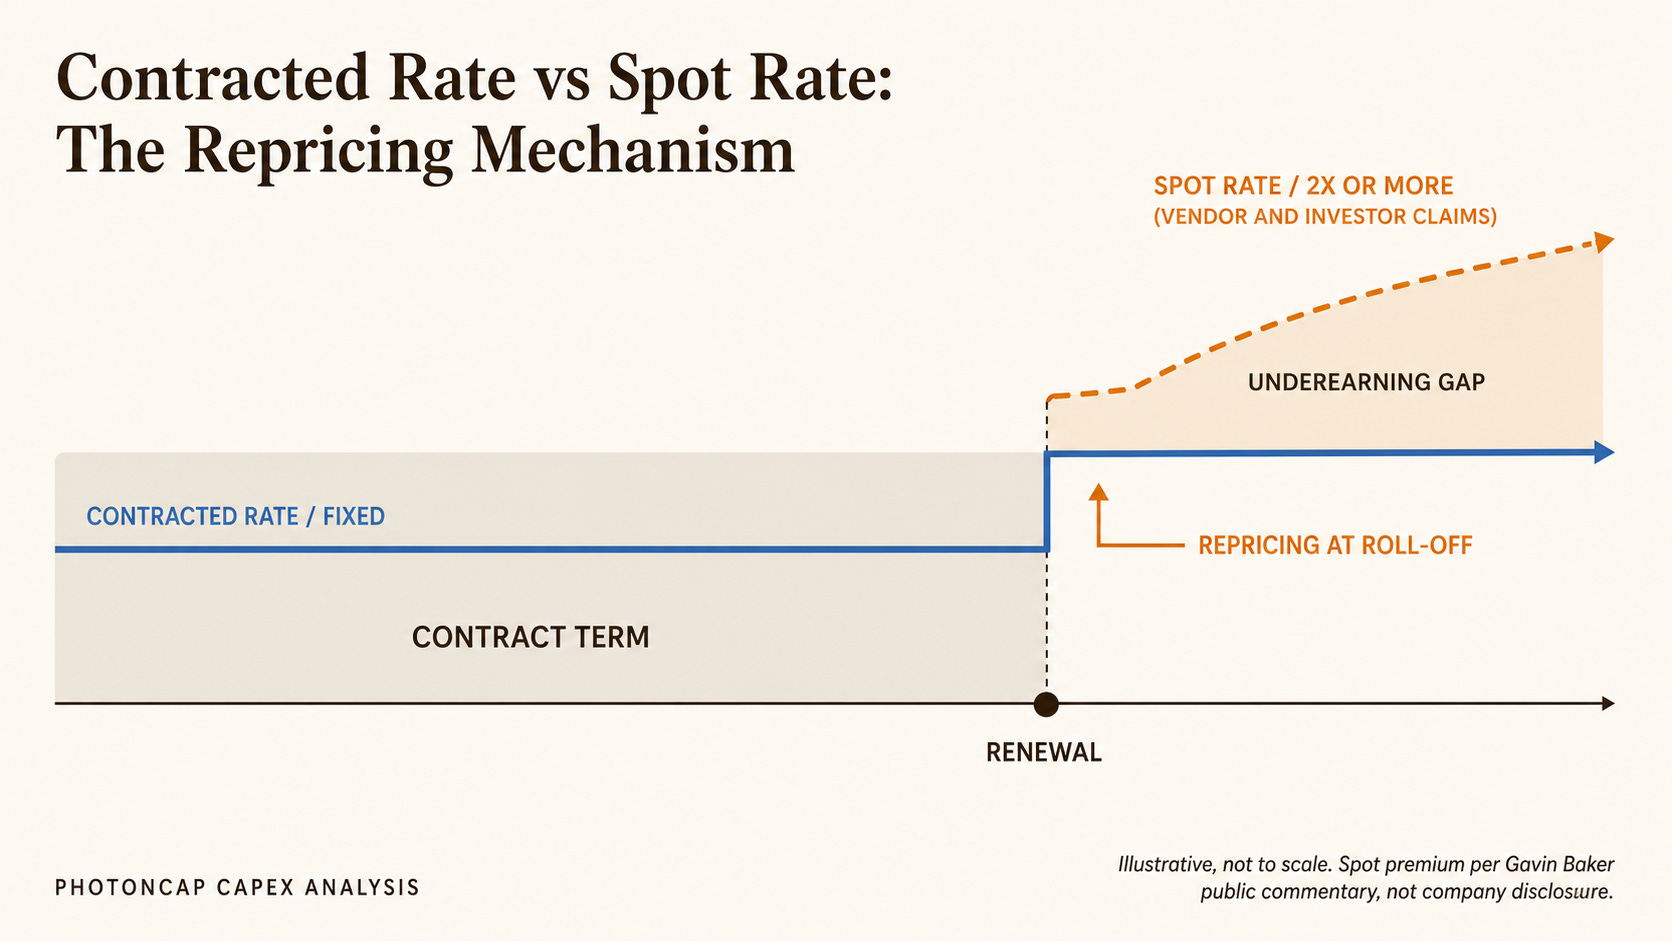
Contracted rate vs spot rate repricing concept
So his conclusion follows from there. As existing contracts expire and renew at new prices, the hyperscalers’ entire installed base reprices upward, and growth does not just hold, it accelerates. In fact, multiple private companies are reportedly planning to pay more than 2x per GPU after their contracts expire [2]. He modeled combined hyperscaler operating cash flow growth accelerating from 31% in Q1 to 50% in Q2 [2], and this figure is not a measurement but a calculation mixing his estimates with reported results. Of course, I have not been able to recalculate this model, but I looked for a way to verify the direction and checked whether that direction actually holds. I figured we could just look at whether traces of repricing actually showed up in this quarter’s results.
3. The Four Hyperscalers’ Results: The Numbers
I summarized everything below based on company announcements.
Alphabet (7/22): Total revenue $119.8B, +24%. Google Cloud $24.77B, +82%, beating consensus by more than $2B. Cloud operating income was $8.8B, about three times a year ago. Backlog $514B, with just over half expected to be recognized as revenue within 24 months [1].
Microsoft (7/29): FY26 Q4 revenue $90B, +18%. Azure +43%, with Azure annual revenue crossing $100B for the first time on a fiscal-year basis (+41%). Commercial RPO $678B [5]. Quarterly capex including finance leases was $41B, +69%, and FY2027 capex guidance was reportedly set at $255~260B [6].
Amazon (7/30): Total revenue $200.6B, +20%. AWS $42.2B, +37%, the fastest growth in 18 quarters, with a 39.4% operating margin. The AI business and the in-house chip business each run above $25B annualized [7]. The 2026 capex outlook was raised from about $200B to about $220B [8].
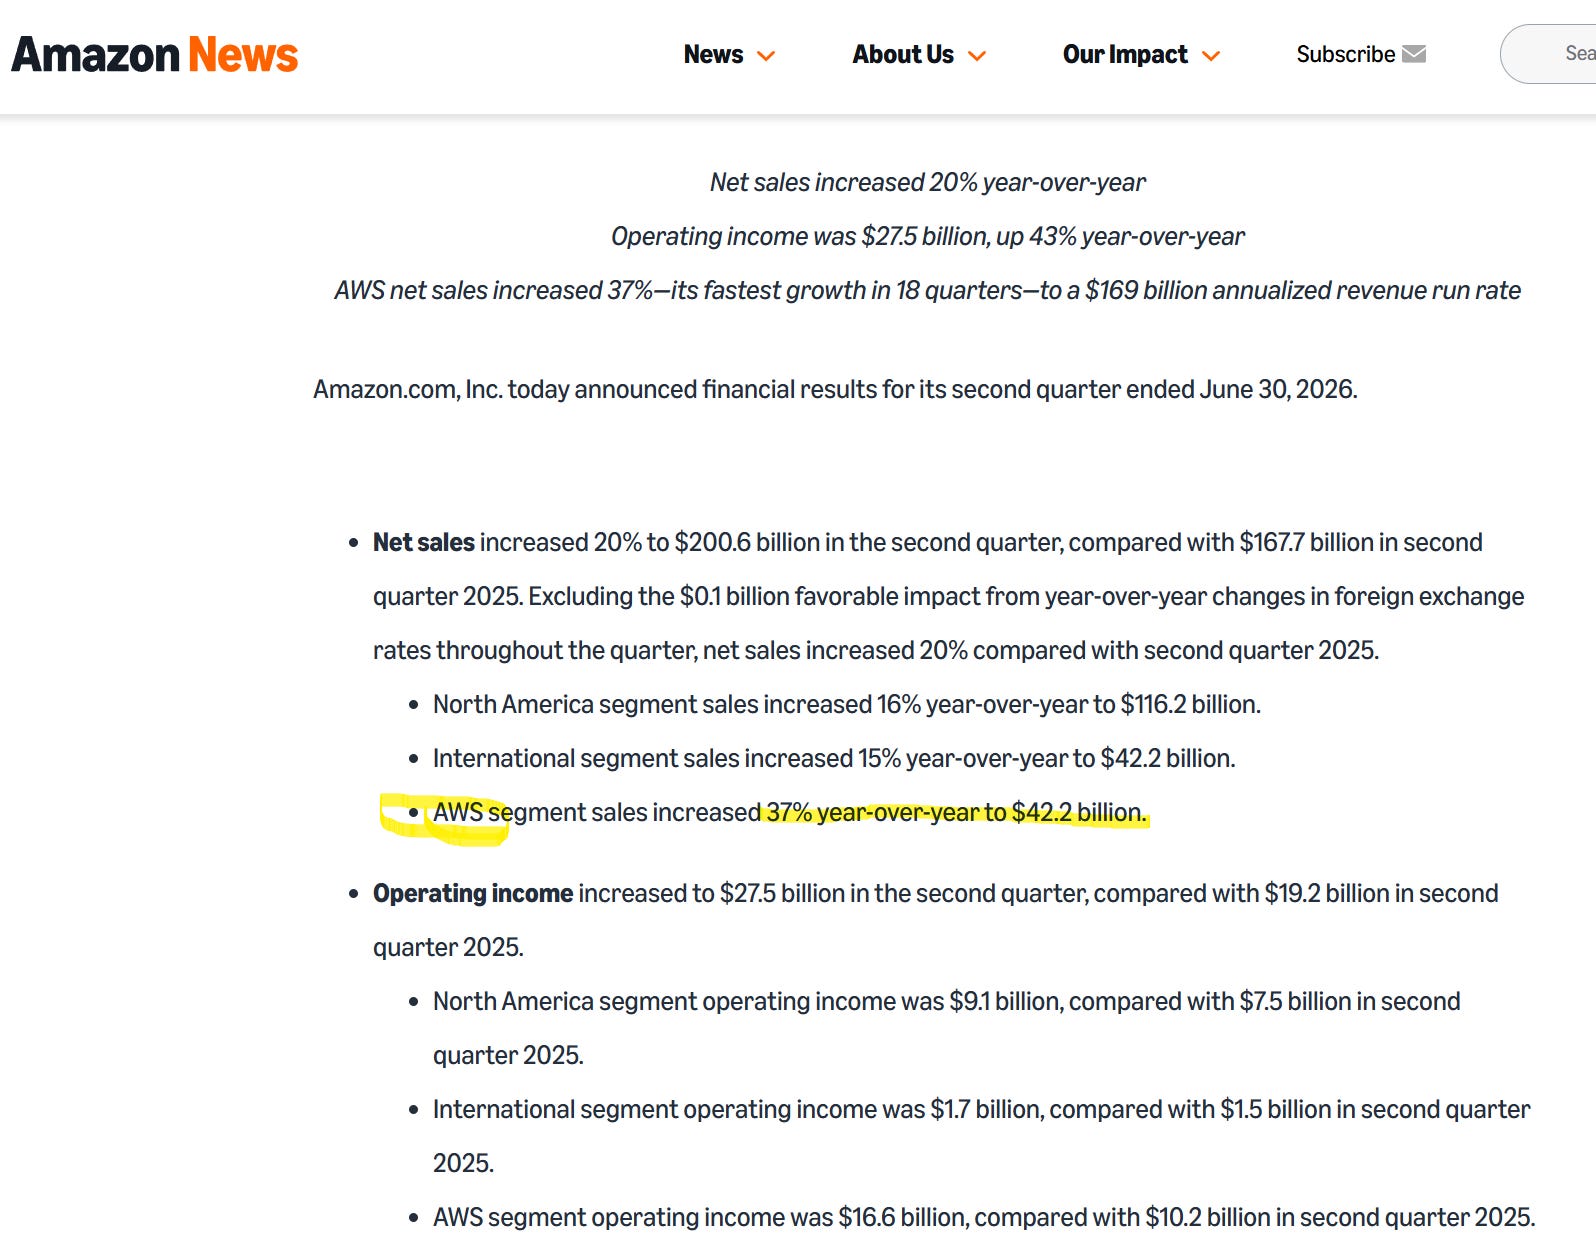
Meta (7/29): Revenue $60.8B, +28%, beating consensus, with an EPS miss. Full-year capex guidance is $130-145B, narrowed from the prior $125-145B by raising the lower end [9]. The lower end is how they showed they have no intention of cutting. AI infrastructure spend was around $31B in this quarter alone, and free cash flow pressure was the theme of the earnings call [10].
Put the four announcements side by side, and cloud revenue growth is accelerating at all three clouds while all four companies raised capex. Two of them saw their stocks slide on cash flow concerns. (In my view, that makes no sense.) You can read this as a picture where the sellers’ growth is speeding up while the buyers’ spending speeds up at the same time. In a market with surplus supply, I doubt these two would show up together.
That ran long, so to sort it out a bit: the premise of Baker’s thesis, that demand exceeds supply and contracted prices lag market rates, and the shape of the four companies’ numbers this quarter show no contradiction anywhere.
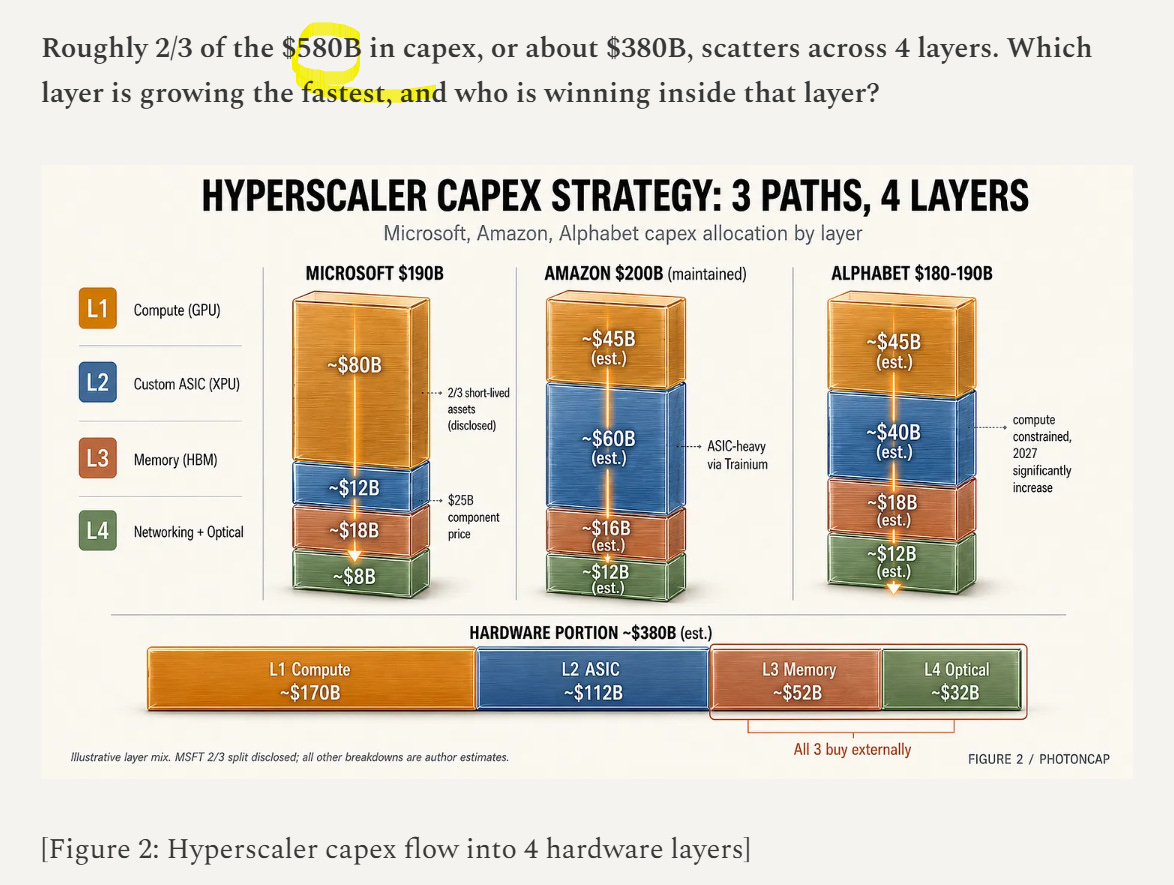
Up to this point, this is an extension of what I wrote on May 11 in The Real Beneficiaries of Azure +40%, AWS +28%, GCP +63%: The Hardware Supply Chain Map Behind $580B in Cloud Capex. That piece drew the map of $580B in combined capex flowing into four hardware layers, and one quarter later, every one of those premise numbers has been revised upward.
4. The Boundary Public Materials Can Show
This is as far as public earnings releases and Baker’s public claims can take us. But to use this in investment decisions, there is more that needs checking.
First, whether there is evidence inside the results that repricing has already started rather than being something still to come. As it happens, two candidate pieces of evidence surfaced this quarter. One came out of Google’s earnings call, and the other is the difference in composition across the three companies’ backlogs. The backlogs of $514B, $638B, and $678B are all huge numbers that look like the same unit, but open them up and the contracts inside are different in character.
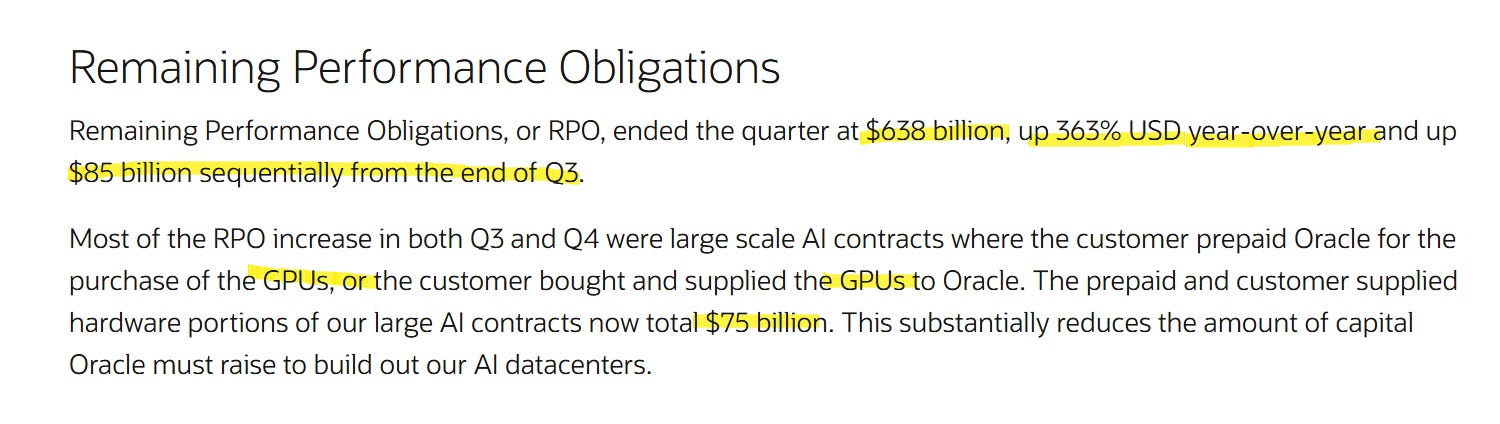
RPO paragraphs from the Oracle FY26 Q4 release
The other question is where the benefit of that repricing prints larger, in hyperscaler stocks themselves or in some hardware layer. There is a hint in the Oracle paragraphs captured above. The portion where customers prepaid for GPUs or bought and supplied them directly amounts to $75B [11], which means compute buyers have started taking on hardware procurement themselves. Why this paragraph matters is unpacked behind the paywall together with backlog quality.
