
The Real Beneficiaries of Azure +40%, AWS +28%, GCP +63%: The Hardware Supply Chain Map Behind $580B in Cloud Capex
$MSFT $AMZN $GOOGL | Cloud Capex Hardware Stack Analysis

On April 29, 2026, Microsoft, Amazon, and Alphabet reported earnings on the same day. Azure grew +40%, AWS +28%, and GCP +63%. Their combined 2026 capex guidance reached approximately $580B. Microsoft and Alphabet raised their guidance, while Amazon maintained its $200B target set in February. This article breaks down where that capex flows across 4 hardware layers and identifies the 10 companies where that spending becomes revenue. All three beat earnings, yet MSFT and AMZN fell -3% AH while GOOGL rose +5.7% AH (+10% next-day close). Understanding why these reactions diverged, and which layer-level winners that divergence points to, is the purpose of this article.
Contents
Same-day earnings, different stock reactions
The 4 layers where capex flows
Paywall hook: which layer benefits most
10 companies across 4 layers, with scale comparison
Layer-by-layer classification, differentiation, and company analysis
Scenarios, monitoring, and conclusion
References & Sources
1. Same-day earnings, different stock reactions
On the evening of April 29, 2026, three 8-K filings hit the SEC within roughly two hours. Microsoft, Amazon, Alphabet. The Big 3 of the U.S. cloud market.
All three beat earnings. Across every line item.
Microsoft: Q3 FY26 revenue $82.9B (+18%), Azure +40% (above 37-38% guidance), Microsoft Cloud $54.5B (+29%), AI run rate $37B (+123% YoY) [1]
Amazon: Q1 2026 revenue $181.5B (+17%), AWS $37.6B (+28%, highest growth in 15 quarters), AI run rate $15B+ [2]
Alphabet: Q1 2026 revenue $109.9B (+22%), Google Cloud $20.0B (+63%), backlog $460B+ (nearly doubled from the prior quarter) [3]
On paper, all three delivered. But after-hours reactions diverged.
MSFT: -3% AH. AMZN: -3% AH. GOOGL: +5.7% AH (+10% next-day close).
All three beat, yet the market priced them differently.
The biggest differentiator was how the market priced each company’s capex ROI. All three maintained or raised their 2026 capex to historically high levels, but the market assessed each company’s return on that capex differently.
Microsoft: FY26 capex $190B (vs. prior consensus of $154.6B, +23%). CFO Hood specified that “$25B reflects component price impacts” [1][4].
Amazon: 2026 capex $200B (maintaining February guidance). $44.2B deployed in Q1 alone [2].
Alphabet: 2026 capex $180-190B (raised from $175-185B). 2027 capex to “significantly increase” [3].
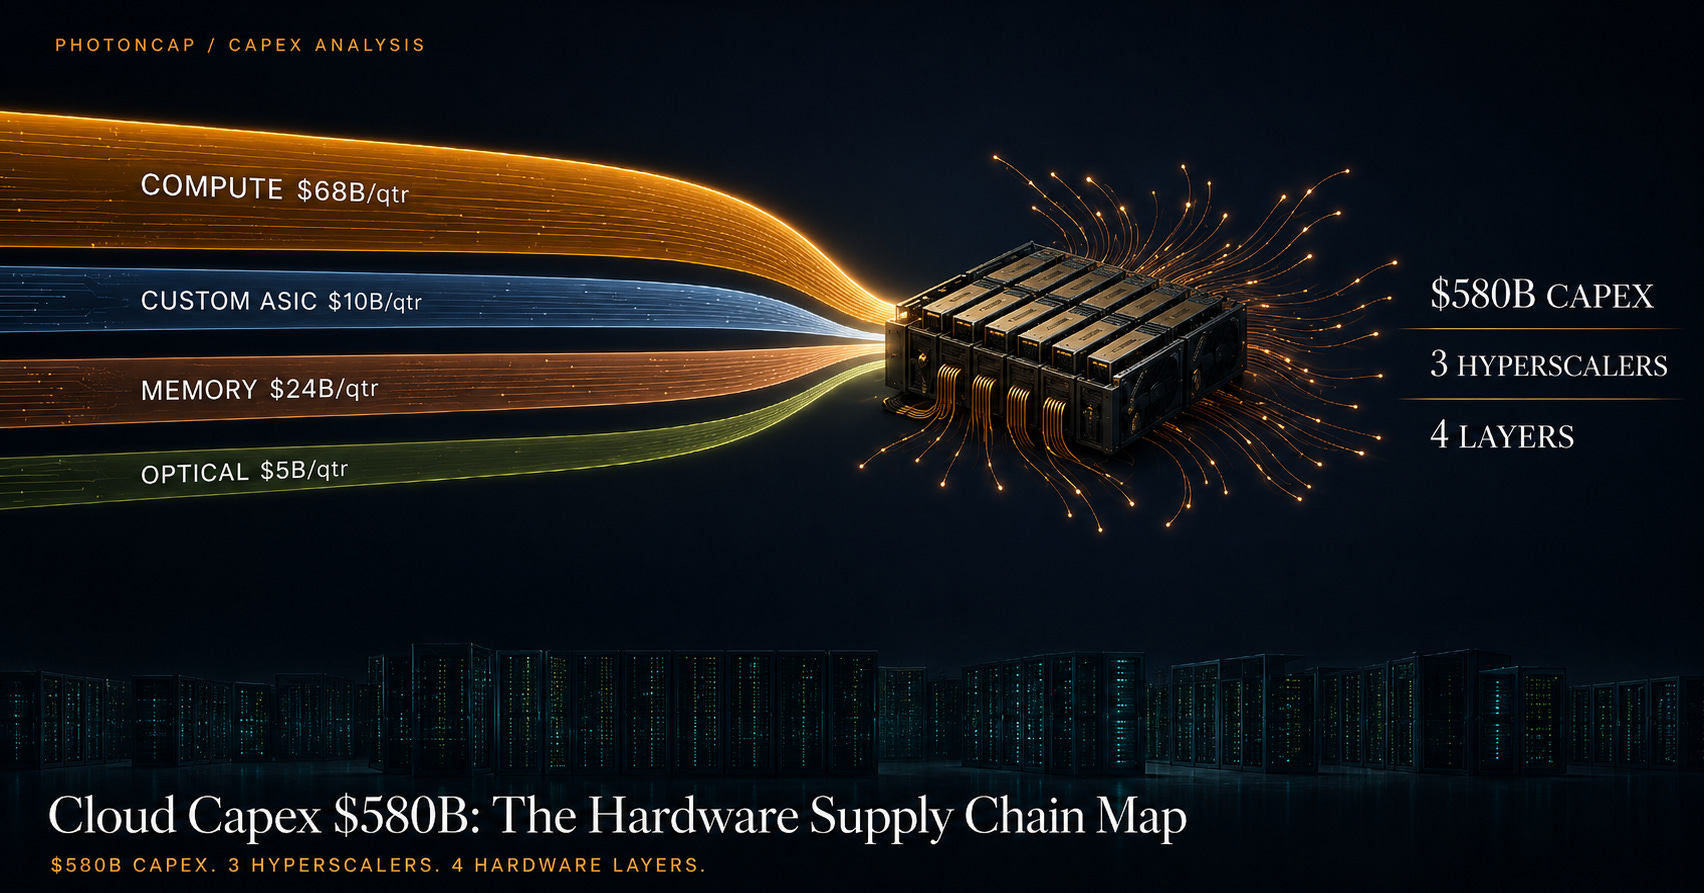
Combined: approximately $580B. Including Meta, the four-hyperscaler total exceeds an estimated $700B [5].
This was the market’s question: “Is this spending justified? Who earns a return on this capital?”
The real question is not about hyperscaler stock prices. It is about the supply chain that receives that capex. Microsoft disclosed this directly on its earnings call: roughly 2/3 of this quarter’s capex went to short-lived assets, meaning GPU and CPU chips, while the remaining 1/3 went to long-lived assets, meaning data centers, land, and power infrastructure [4].
Applying Microsoft’s disclosure as a heuristic across all three, an estimated $380B of the $580B flows to chips and server hardware (conservative estimate). The remaining $200B goes to real estate and power. And within that $380B, there are further layers.
All three are running the same capex race, but their strategies differ. That difference drove the stock reaction divergence.
Why GOOGL reacted strongly on its own: GCP revenue of $20.0B at +63% is more than double the growth rate of AWS (+28%). Pichai saying “we are compute constrained” on the earnings call was a strong signal that demand exceeds supply [3]. Backlog nearly doubling to $460B gave the market confidence that Alphabet’s capex spending is still justified. The preview of “significantly increasing” 2027 capex was read as a reward, not a penalty.
Why MSFT and AMZN fell -3%: Microsoft’s $190B capex guidance exceeded the prior consensus by over $35B. CFO Hood carved out “$25B from component prices” [4], but the market had not yet decided whether that $25B was an unavoidable pass-through of GPU pricing power or a sign of inefficiency. Amazon faced a similar dynamic. Deploying $44.2B in Q1 alone (22% of the $200B guide in a single quarter), the market questioned whether AWS revenue growth of +28% was sufficient to justify the pace of spending.
One insight emerges from this. The market is not penalizing capex itself. It is watching how quickly capex converts to revenue growth. GCP at +63% read as fast ROI. Azure at +40% and AWS at +28% read as relatively slower returns.
But flip this to a supply chain perspective and the conclusion reverses entirely. All three are sustaining or increasing capex, and the vast majority flows into overlapping supply chains. Whether GOOGL goes +10% or MSFT goes -3%, both are drawing from overlapping pools of GPUs, HBM, networking switches, and optical components. Hyperscaler stock reactions diverged, but the total capital flowing into the hardware supply chain grew in aggregate.
Section 1 takeaway: The cloud Big 3 all beat earnings on the same day, yet stock reactions diverged. The difference was the market’s assessment of capex ROI velocity. But from a supply chain perspective, all three are increasing capex, and roughly 2/3 of that capital flows into the same chips and hardware. When hyperscaler stocks diverge, the alpha often shows up in supply chain names instead.
2. The 4 layers where capex flows
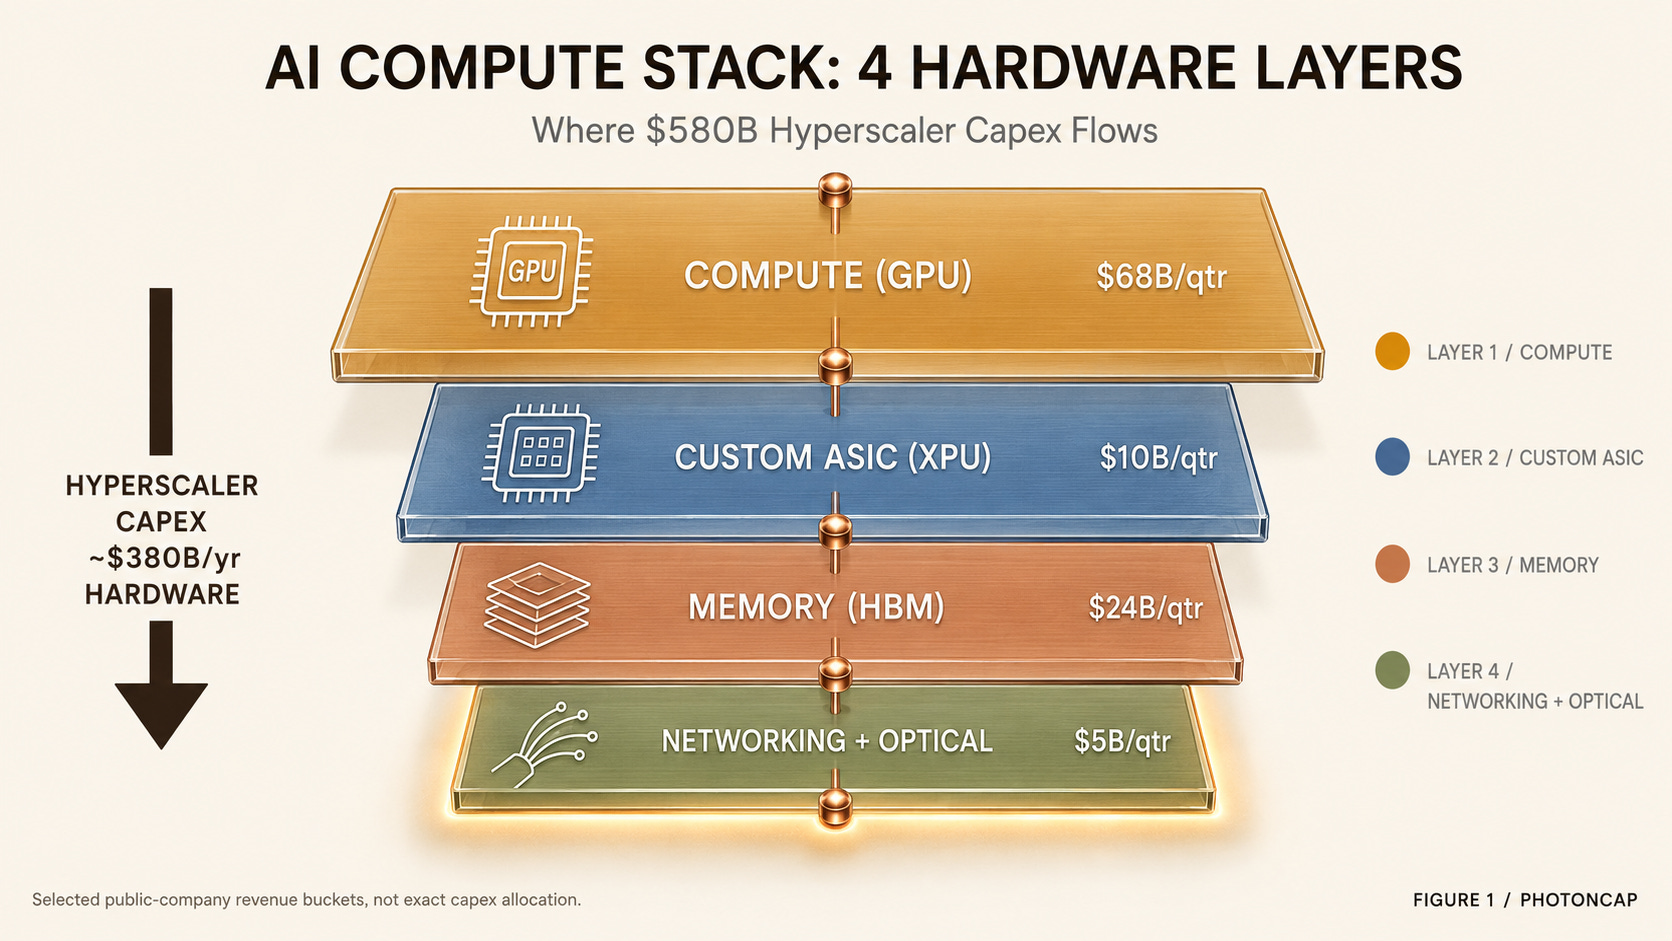
The hardware portion of hyperscaler capex breaks down into layers. This is the analytical framework for the article.
Layer 1: Compute (GPU) is the main chip that trains and runs AI models. Products like the NVIDIA Blackwell GPU sit here. For hyperscalers, this is the single largest cost item. Hyperscalers account for approximately 50% of NVIDIA’s Q4 FY26 data center revenue of $62.3B (+75% YoY) [6]. NVIDIA does not own this layer alone, however. There is one challenger, and the difference in 1Y returns between the two shows how layer dynamics work.
Layer 2: Custom ASIC (XPU) refers to chips that hyperscalers design in-house, optimized for their own workloads. Google’s TPU, Amazon’s Trainium, and Meta’s MTIA are the most prominent examples. Design IP, IO, and packaging are handled by fabless design partners, and two companies effectively split this layer. Revenue scale and margin trajectories diverge quarter by quarter. This layer is growing fast because hyperscalers want to reduce NVIDIA dependency and build chips better suited to their specific workloads.
Layer 3: Memory (HBM) is the high-bandwidth memory that sits next to GPUs and ASICs. Memory bandwidth is the bottleneck for both AI training and inference. As models grow larger, both HBM capacity and speed become critical. Three companies effectively split this market, and in the 2026 cycle, one of them nearly tripled its revenue in a single year. Which company that is sits at the core of the thesis.
Layer 4: Networking + Optical is the fabric that connects GPUs and ASICs into clusters. AI training clusters require tens of thousands to hundreds of thousands of GPUs running a single model simultaneously, making chip-to-chip communication as important as the chips themselves. This sub-divides further.
Networking switch: Ethernet-based switches (transitioning from 800G to 1.6T) or NVIDIA’s own fabric like NVLink and InfiniBand.
Optical interconnect: optical transceivers connecting switches to GPUs/ASICs. Also transitioning from 800G to 1.6T.
What makes this layer interesting is that the entire layer outperformed together. Other layers have one company dominating internally. This layer saw every constituent benefit from the cycle. And within the layer, one stock posted a 1Y return larger than anything in NVIDIA’s league. A mid-cap name with returns on a different order.
[Figure 1: AI compute stack 4-layer diagram]
These 4 layers are interdependent. You cannot just buy GPUs and have them work. HBM must come along, and networking switches and optical transceivers are needed to connect them into clusters. So capex flows into all 4 layers nearly simultaneously. The mix across layers differs, though, and that mix shifts over time.
One interesting datapoint from NVIDIA’s Q4 FY26. Of the $62.3B in data center revenue, networking revenue alone was $11B, up +263% YoY [6]. Networking’s share of data center revenue rose from under 9% a year ago to 18%. Even within a single company, the revenue mix is shifting rapidly.
That is one company’s story, but scaling it to the layer level creates a single question.
Roughly 2/3 of the $580B in capex, or about $380B, scatters across 4 layers. Which layer is growing the fastest, and who is winning inside that layer?
[Figure 2: Hyperscaler capex flow into 4 hardware layers]
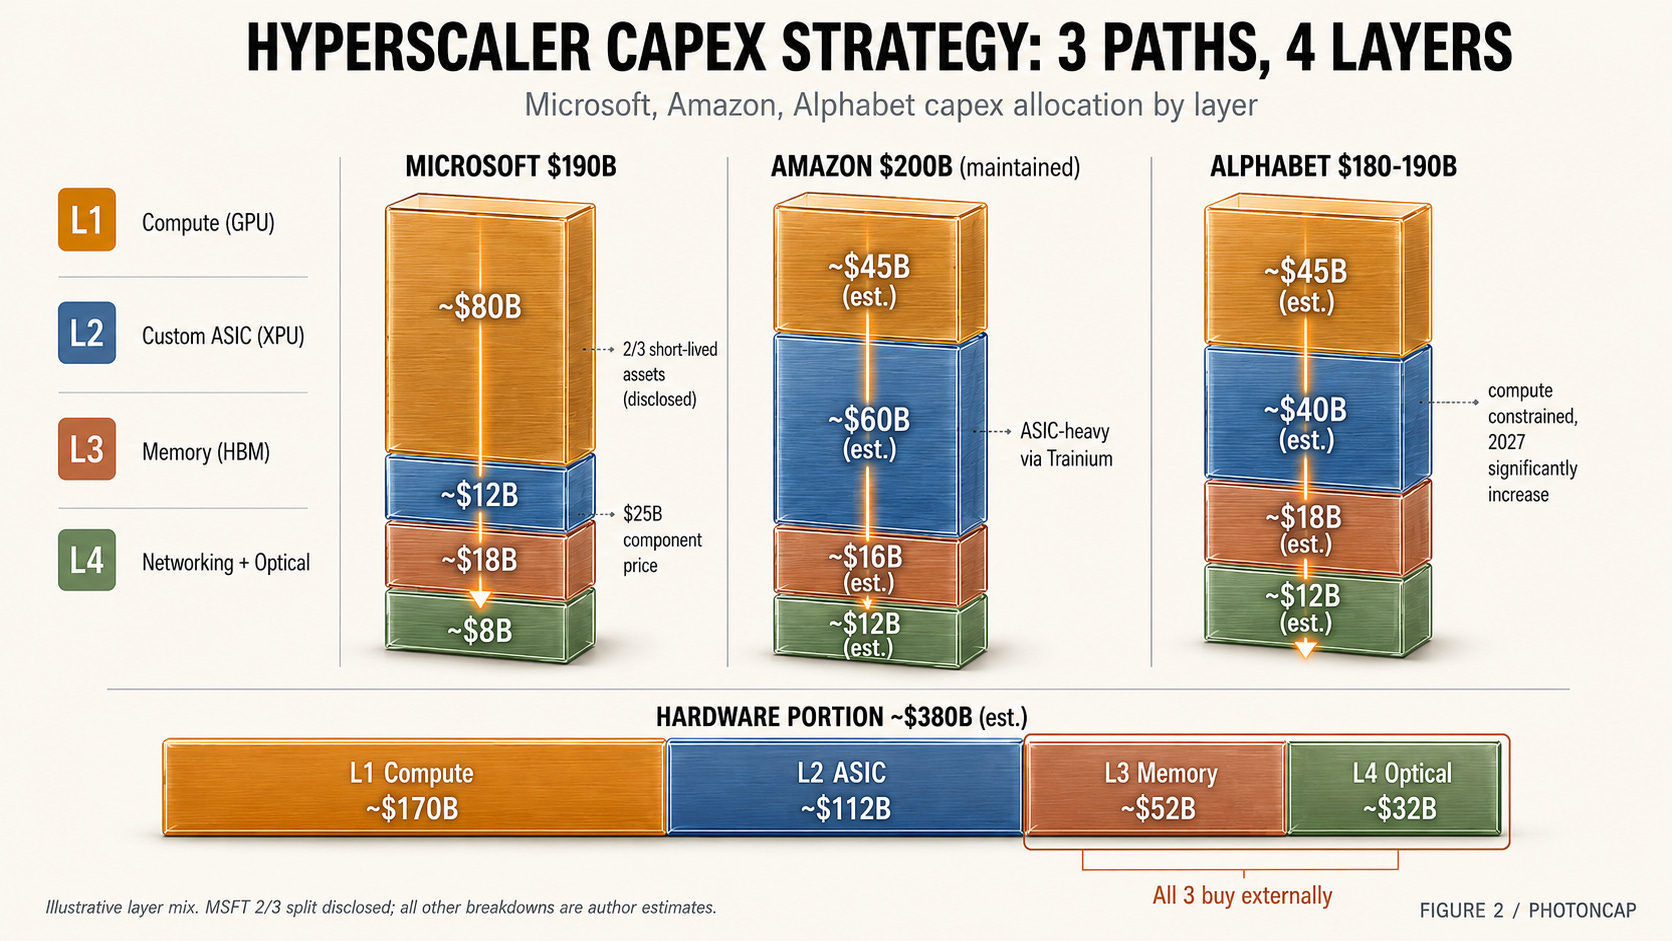
One more point before moving on: the three companies’ capex strategies are not identical.
Microsoft made the most transparent disclosure. CFO Hood explicitly split capex into 2/3 short-lived assets (chips and servers) and 1/3 long-lived assets (data centers, land, power) [4]. He also specified that $25B of the short-lived portion reflects component price impacts. This means GPU price increases are a structural driver pushing capex higher. As long as NVIDIA holds pricing power, a significant portion of capex flows to Layer 1 by default. NVIDIA is not staying in Layer 1 alone. It has made $2-3.2B equity investments in Coherent, Lumentum, Marvell, and Corning, directly locking in Layer 4 supply chains. (The background and implications of these investments were covered in our previous article, “NVIDIA’s Four 2026 Photonics Investments.”)
NVIDIA's $4 Billion Photonics Bet: Broadcom Wasn't Wrong — But the Market Completely Misread the Signal

1. Introduction: The Announcement and the Market’s Reaction
Coherent, Lumentum, Marvell, and Now Corning: NVIDIA’s 4 Photonics Bets and the Path of Light

NVIDIA made four direct investments into photonics companies in 2026. Coherent and Lumentum got $2B each on March 2, Marvell got $2B on March 31, and on May 6 Corning got a $500M warrant deal plus a multi-year commercial partnership. The first three sit in the transceiver, laser, and DSP layers, the companies that generate, control, and interface with light. The fourth one, Corning, makes the medium that light actually travels through: optical fiber, cable, and connectors. This article walks through why NVIDIA’s fourth bet went to a different layer, and why the connectivity layer matters as much as the transceiver layer.

Amazon takes a different angle. AWS is the most aggressive hyperscaler on in-house chips (Trainium, Graviton). Amazon deployed $44.2B in Q1. Amazon is pushing Trainium/Graviton harder than any peer, suggesting its capex mix likely tilts more toward Layer 2 (Custom ASIC) than Layer 1 (NVIDIA GPU), though exact layer-level capex allocation has not been disclosed.
Alphabet is the most aggressive overall. 2026 capex of $180-190B, followed by a “significant increase” in 2027 [3]. Google Cloud backlog of $460B signals that secured demand justifies years of future capex. Google is pursuing in-house design across Layer 1, 2, and 4 with TPU v6 (Trillium) and proprietary optical interconnects.
How these strategic differences affect layer beneficiaries: Microsoft has the highest NVIDIA dependency (Layer 1 heavy). Amazon has the highest ASIC dependency (Layer 2 heavy). Alphabet pursues in-house design across the most layers (most diversified). But all three rely on external procurement for HBM (Layer 3) and optical interconnects (Layer 4). Some layers simply cannot be brought in-house. Identifying those layers is the focus of the next section.
Section 2 takeaway: The AI compute stack splits into 4 layers: Compute, Custom ASIC, Memory, and Networking + Optical. The three hyperscalers’ capex strategies tilt differently across layers, but HBM and optical interconnects are externally sourced by all three. Just as networking mix within NVIDIA shifted +263%, the mix shift across layers is what determines stock selection.
3. Which layer benefits most
Everything above can be assembled from public earnings filings and quarterly reports. Cloud acceleration, capex raises, distribution across 4 layers.
The real differentiation lies in identifying who wins inside each layer. And the shape of the winner differs by layer.
In one layer, a single $5T company dominates the entire layer, and the challenger’s market cap is roughly 1/7th of that. Yet the challenger’s 1Y return is more than 4x higher. Why? Because a smaller market cap base means greater return leverage on the same revenue increment. That is Layer 1.
In another layer, two companies split the market, but one company’s AI revenue exceeds the other’s total revenue. Margin trajectories diverge for reasons directly tied to where design service value is created. That is Layer 2.
In yet another layer, all three companies share the same cycle, but one of them broke through $800B in market cap this week. The best weekly return since December 2008. That is Layer 3.
And in the final layer, the entire layer outperformed, with one stock posting a +1,309% 1Y return. It joins the Nasdaq-100 on May 18. But another stock in the same layer beat earnings and still dropped -14%. Same layer, opposite reactions. Why? That is Layer 4.
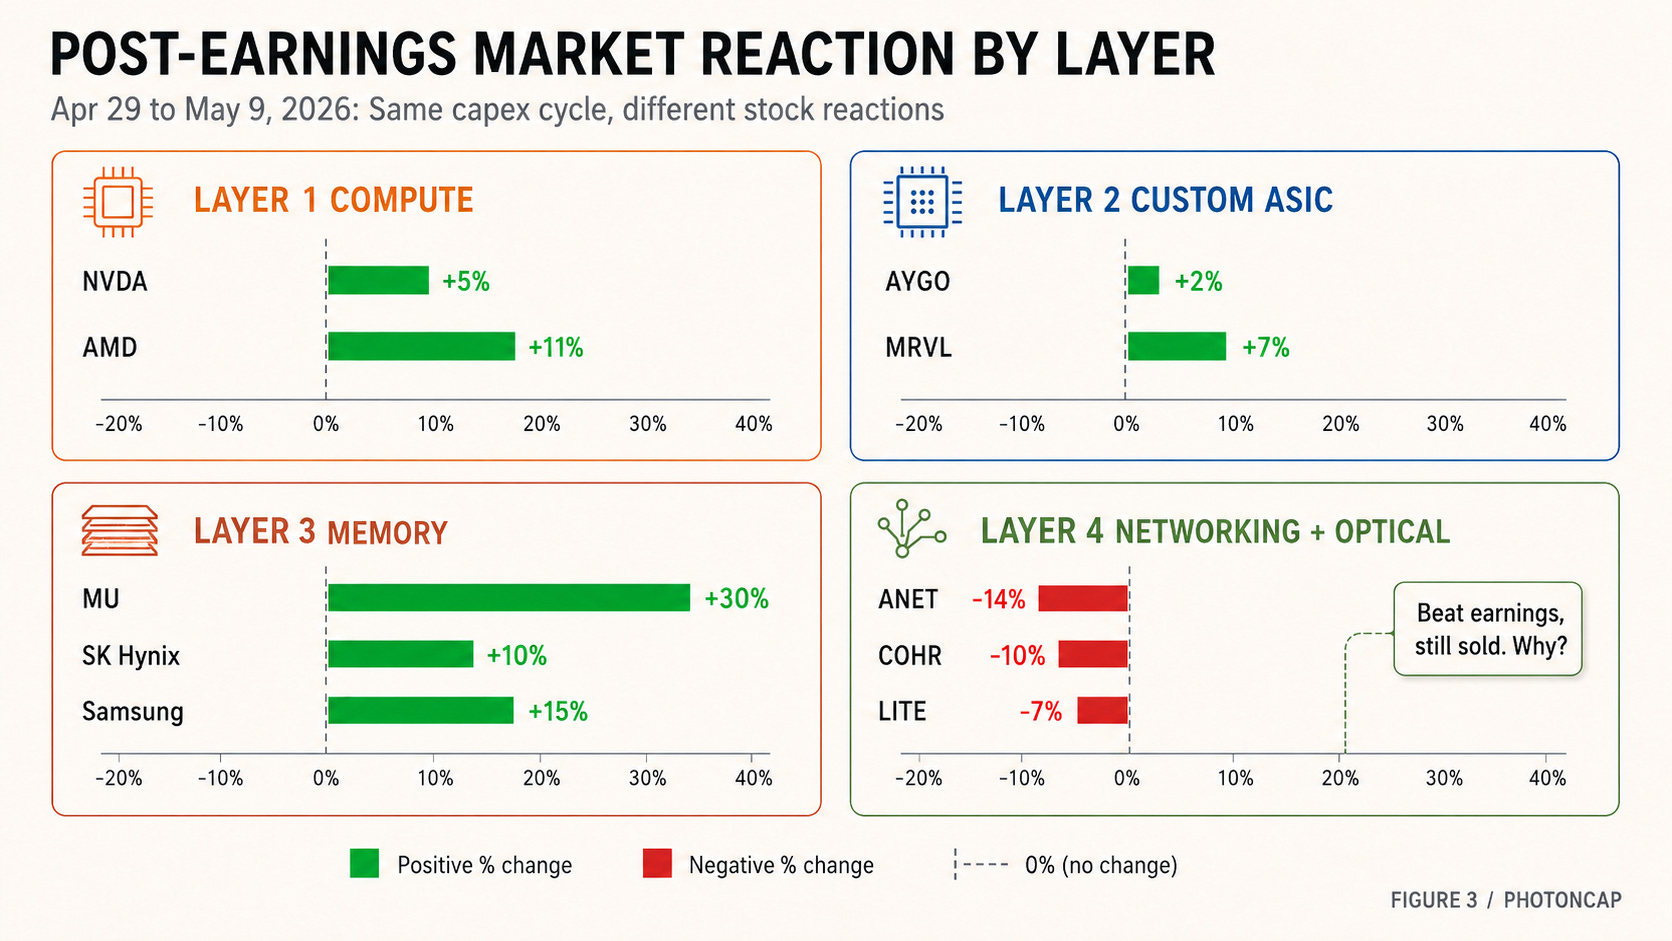
One more thing. Following the hyperscaler earnings on April 29, supply chain companies reported earnings throughout the first week of May, and layer-by-layer reactions split sharply. AMD surged +11%. Arista plunged -14%. LITE fell -7% on sector profit-taking despite beating. Micron gained +30% in a single week. All sharing the same $580B capex cycle. Why such divergence?
[Figure 3: 4 layers positioning + post-earnings market reaction]
Summarizing the 4 layers in one line each.
Layer 1 (Compute): NVIDIA + challenger. NVIDIA dominates on market cap. The challenger outperforms on returns.
Layer 2 (Custom ASIC): 2 design partners split the market. The market’s question is margins.
Layer 3 (Memory): 3 companies move together. The most leveraged name in the cycle moves fastest.
Layer 4 (Networking + Optical): Entire layer outperformed. Within it, +1,309% vs. -14%.
The following sections unpack each.
10-company identification table across 4 layers
Market cap and revenue scale comparison
1Y return classification by layer
Layer differentiation + Bull/Gap/Optionality for each company
Capex scenario (Base / Alternative / Downside) mapping by layer
The 8 Companies Behind Lumentum’s $808M Quarter: Why Beta Splits by Orders of Magnitude Across the InP Cycle

Quarterly revenue $808.4M, +90% YoY. Lumentum reported FY26 Q3 earnings after market close on May 5, 2026. 200G EML revenue doubled in a single quarter, narrow linewidth laser posted its ninth consecutive quarter of sequential growth at +120% YoY, and Q4 guidance of $960M to $1,010M puts the upper bound above $1B for the first time. This single earnings print transmits across four layers of the InP supply chain (substrate, MOCVD/MBE epi tool, epi service, laser chip OEM) and into five distinct company groups (pure-play substrate, pure-play epi service, multi-segment tool, lower-beta adjacent, internal capture), each receiving a dramatically different magnitude of beta. The same earnings headline produced +297% in one layer, +50% in another, and +5,000% in yet another. This article analyzes the structure of that asymmetry.
If you hold NVIDIA, the most critical variable is how fast hyperscalers shift to in-house chips (Layer 2). If you hold Micron, it is whether HBM4 yield ramp can close the gap with SK Hynix. If you hold Arista, it is when supply chain constraints ease. The questions differ by layer, and the answers determine which stock’s return diverges by an order of magnitude within the same $580B capex cycle.
