[Investment Map] The Real Bottleneck 7,000m Below: The $13B Cycle Held by 60 Ships
$GLW $COHR $CIEN $NOK + hidden wet-plant exposure | AI Subsea Cable Supply Chain Investment Map


Over 95% of international internet data travels through subsea fiber optic cables. Yet only about 60 dedicated cable-laying vessels exist worldwide, with an average fleet age of 25 years. New subsea cable investment for 2025 to 2027 is projected at $13B, nearly double the prior three-year period [1]. With Google, Meta, Amazon, and Microsoft all placing orders simultaneously, the bottleneck sits at cable-laying ships and EDFA repeaters. This article breaks down the subsea cable supply chain into 5 tiers (fiber, cable, wet plant, optical components, installation) and scores 8 listed companies using the PhotonCap GVM 5-axis framework. The market has already repriced fiber and cable. Wet plant scarcity has not yet been recognized as a standalone asset.
This is the third article in the PhotonCap Investment Map series. The glass substrate map covered the supply chain above AI data centers. The LEO satellite map covered the orbital layer. This one covers what sits beneath the ocean between data centers. The EDFA pump laser inside a subsea repeater sits in the same III-V compound semiconductor manufacturing ecosystem as the laser in CPO transceivers and the optical component in satellite OISL terminals. Three cycles converge at the component tier.
The third installment of the PhotonCap Investment Map series is out. This is also the second investment map collaboration with Damnang and Nutty, following the glass substrate map. This time, we go beneath the ocean between AI data centers: subsea cables.
Contents
Introduction
Technical background: How subsea cables work
GVM Framework + Where the real difference begins
Company identification + scale comparison
GVM Score: 5-Axis Heatmap
Classification + differentiation + company analysis
Scenarios + monitoring + conclusion
References & Sources
1. Introduction
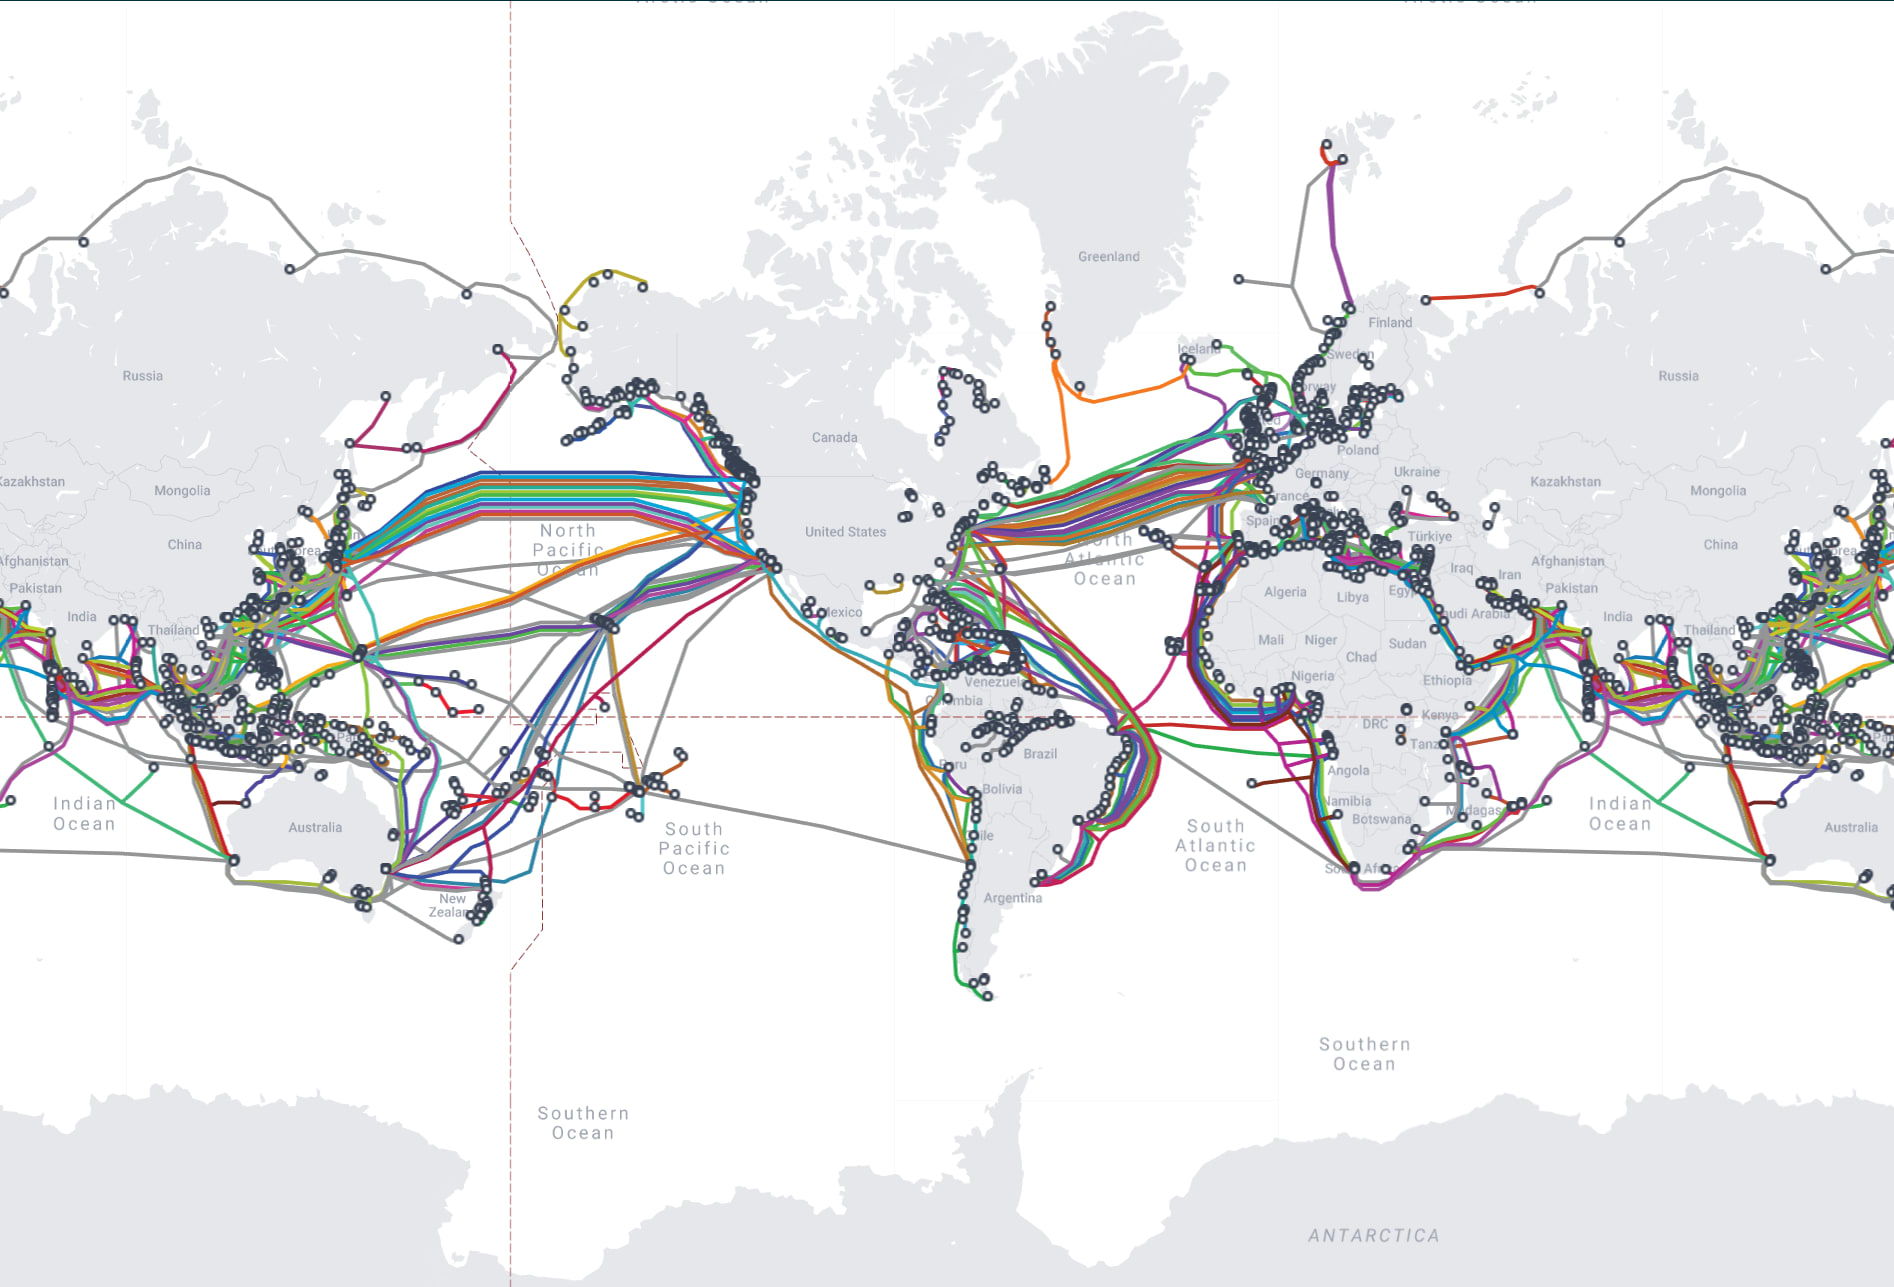
Over 95% of international data traffic flows through subsea fiber optic cables [2]. Financial transactions, video calls, cloud computing, and now AI training data. Subsea cables are the physical spine of the internet.
The problem: only about 60 dedicated cable-laying vessels exist worldwide to build that spine [3]. Average fleet age is 25 years [4]. A new build costs $200M to $500M per vessel [4]. Construction lead time exceeds two years. Right now, utilization rates for these ships exceed 85%, and the project queue extends years out [5].
New subsea cable investment is projected to reach $13B over 2025 to 2027. That is nearly double the prior three-year period (2022 to 2024) [1].
The driver is clear. AI. Building data centers is not enough. You need the physical backbone connecting them. As Meta VP of Engineering Gaya Nagarajan put it: “Without the connectivity that connects those data centers, what you have are really expensive warehouses” [2].
So hyperscalers are putting money directly into the ocean floor. In a previous article, “The Real Beneficiaries of Azure +40%, AWS +28%, GCP +63%”, we tracked where $580B in cloud capex flows inside data centers: GPUs, HBM, and optical transceivers. This article tracks the $13B flowing into the physical connection between data centers: subsea cables.
The Real Beneficiaries of Azure +40%, AWS +28%, GCP +63%: The Hardware Supply Chain Map Behind $580B in Cloud Capex

On April 29, 2026, Microsoft, Amazon, and Alphabet reported earnings on the same day. Azure grew +40%, AWS +28%, and GCP +63%. Their combined 2026 capex guidance reached approximately $580B. Microsoft and Alphabet raised their guidance, while Amazon maintained its $200B target set in February. This article breaks down where that capex flows across 4 hardware layers and identifies the 10 companies where that spending becomes revenue. All three beat earnings, yet MSFT and AMZN fell -3% AH while GOOGL rose +5.7% AH (+10% next-day close). Understanding why these reactions diverged, and which layer-level winners that divergence points to, is the purpose of this article.
Google operates multiple proprietary subsea cables including Curie, Dunant, Grace Hopper, and Equiano, and announced TalayLink (Australia to Thailand) in late 2025 [6]. Meta officially unveiled Project Waterworth in February 2025: 5 continents, 50,000km, 24 fiber pairs, maximum depth 7,000m. Reported investment exceeds $10B [7][8]. Amazon is constructing Fastnet, a US-to-Ireland cable targeting 2028 completion [6].
A decade ago, subsea cables were built by telecom consortium cost-sharing. Today hyperscalers commission and own them directly [1][9]. That structural shift is creating investment opportunities across the entire supply chain.
Scope: this article breaks down the subsea cable supply chain into 5 tiers, scores 8 listed companies across those tiers using the GVM 5-axis framework, and identifies where the bottleneck sits. This is the third installment following the glass substrate and LEO satellite maps.
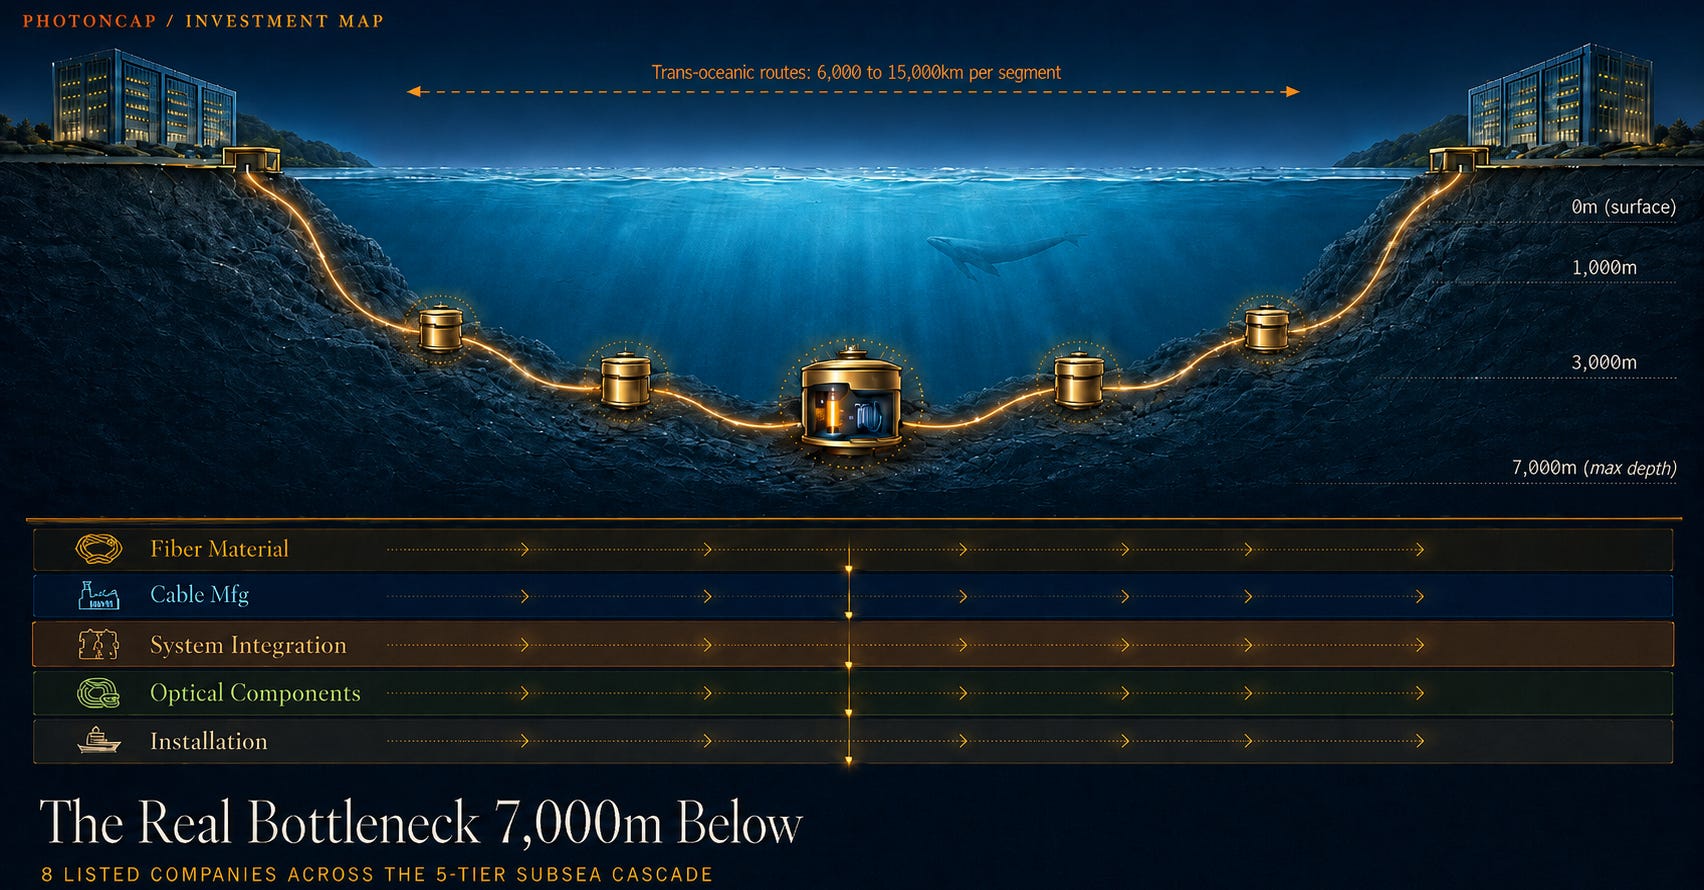
[Figure 1: AI Datacenter Interconnect via Subsea Cable (datacenter to landing station to submarine cable with repeaters to landing station to datacenter)]
2. Technical background: How subsea cables work
2.1 The physics of subsea cables
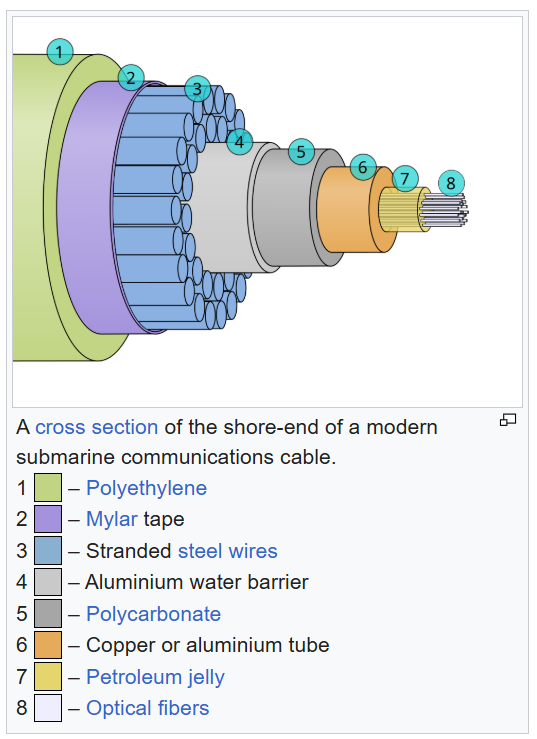
At the core of every subsea cable is optical fiber. Glass preforms are melted in drawing towers hundreds of meters tall, pulled into strands thinner than human hair, bundled into dozens of fiber pairs, then wrapped in steel wire armor and polyethylene sheathing. That produces a submarine cable.
The problem is signal attenuation. Light weakens as it travels through glass. Roughly every 60 to 80km, the signal degrades to the point where re-amplification is required. That is the job of the repeater, specifically the EDFA (Erbium-Doped Fiber Amplifier) [10].
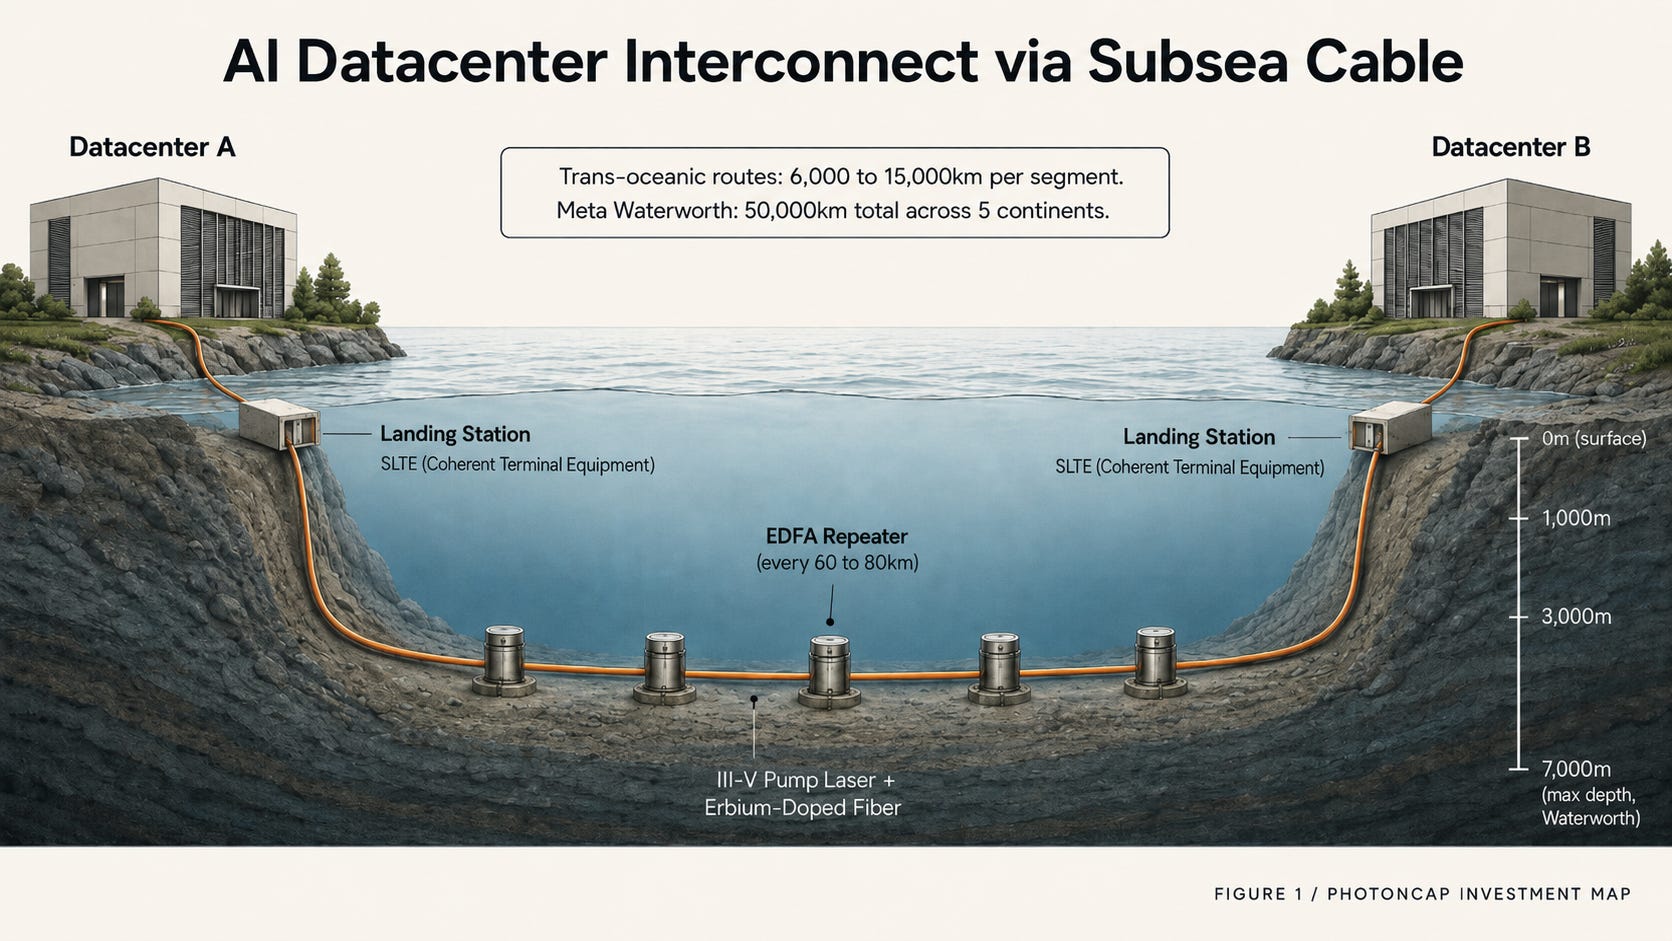
[Figure 2: Subsea Cable Cross-Section + EDFA Repeater Block Diagram (fiber pair to EDFA to WDM to fiber pair, with III-V pump laser callout)]
An EDFA works by pumping energy from a high-reliability III-V compound semiconductor pump laser (typically 980nm or 1480nm) into erbium-doped specialty fiber, which amplifies the weakened optical signal back to full strength. A 10,000km trans-Pacific cable contains hundreds of these repeaters [10]. Each one is a combination of III-V pump laser, erbium-doped fiber, and WDM coupler.
Here is where PhotonCap readers should pay attention. The III-V pump laser in an EDFA sits in the same high-reliability compound semiconductor manufacturing ecosystem as the CPO/SiPh transceiver laser source covered in the glass substrate map and the satellite OISL terminal component covered in the LEO satellite map. Not every subsea pump is an InP device (980nm pumps are typically GaInAs/GaAs, while 1480nm pumps are InP-based), but all three cycles converge at the III-V compound semiconductor manufacturing tier. This is not coincidental. The optical component supply chain is application-agnostic.
2.2 Supply chain: 5-tier structure
The subsea cable supply chain breaks into 5 tiers.
T1. Material (fiber + preform): Raw material for subsea cables. Corning is the largest player in this tier. European and Japanese fiber manufacturers also participate.
T2. Cable Manufacturing: Wrapping optical fiber in steel wire armor, insulation, and outer sheathing to produce cables that survive decades on the ocean floor. Key listed companies sit in Europe, and one of them is the only Western cable manufacturer that owns its own cable-laying vessels.
T3. System Integration (wet plant): The narrowest bottleneck. This tier designs and integrates the wet plant (repeaters, branching units, and submerged optical equipment) while also coordinating dry-plant interfaces such as SLTE and power-feeding equipment. Only 4 companies globally can do this: SubCom (US), ASN (France), HMN Technologies (China), and NEC (Japan) [12][13]. Excluding China-linked HMN Tech from Western hyperscaler procurement, the non-China shortlist narrows to SubCom, ASN, and NEC. Only NEC is publicly listed. It is a $41B IT conglomerate where subsea cable revenue sits in the single-digit percentage range of total sales, meaning the market does not separately value this business. Where this company lands in the GVM framework is covered beyond the paywall.
T4. Optical Components + Coherent Systems: Supplying the pump lasers and WDM couplers for EDFA, plus coherent DSP/transponders for landing stations. The same component tier covered in the CPO map applies here.
T5. Installation (cable-laying vessels + subsea construction): The ships and crew that physically lay cable on the ocean floor. Of the roughly 60 dedicated vessels worldwide, far fewer can handle modern large-scale projects [3][4].
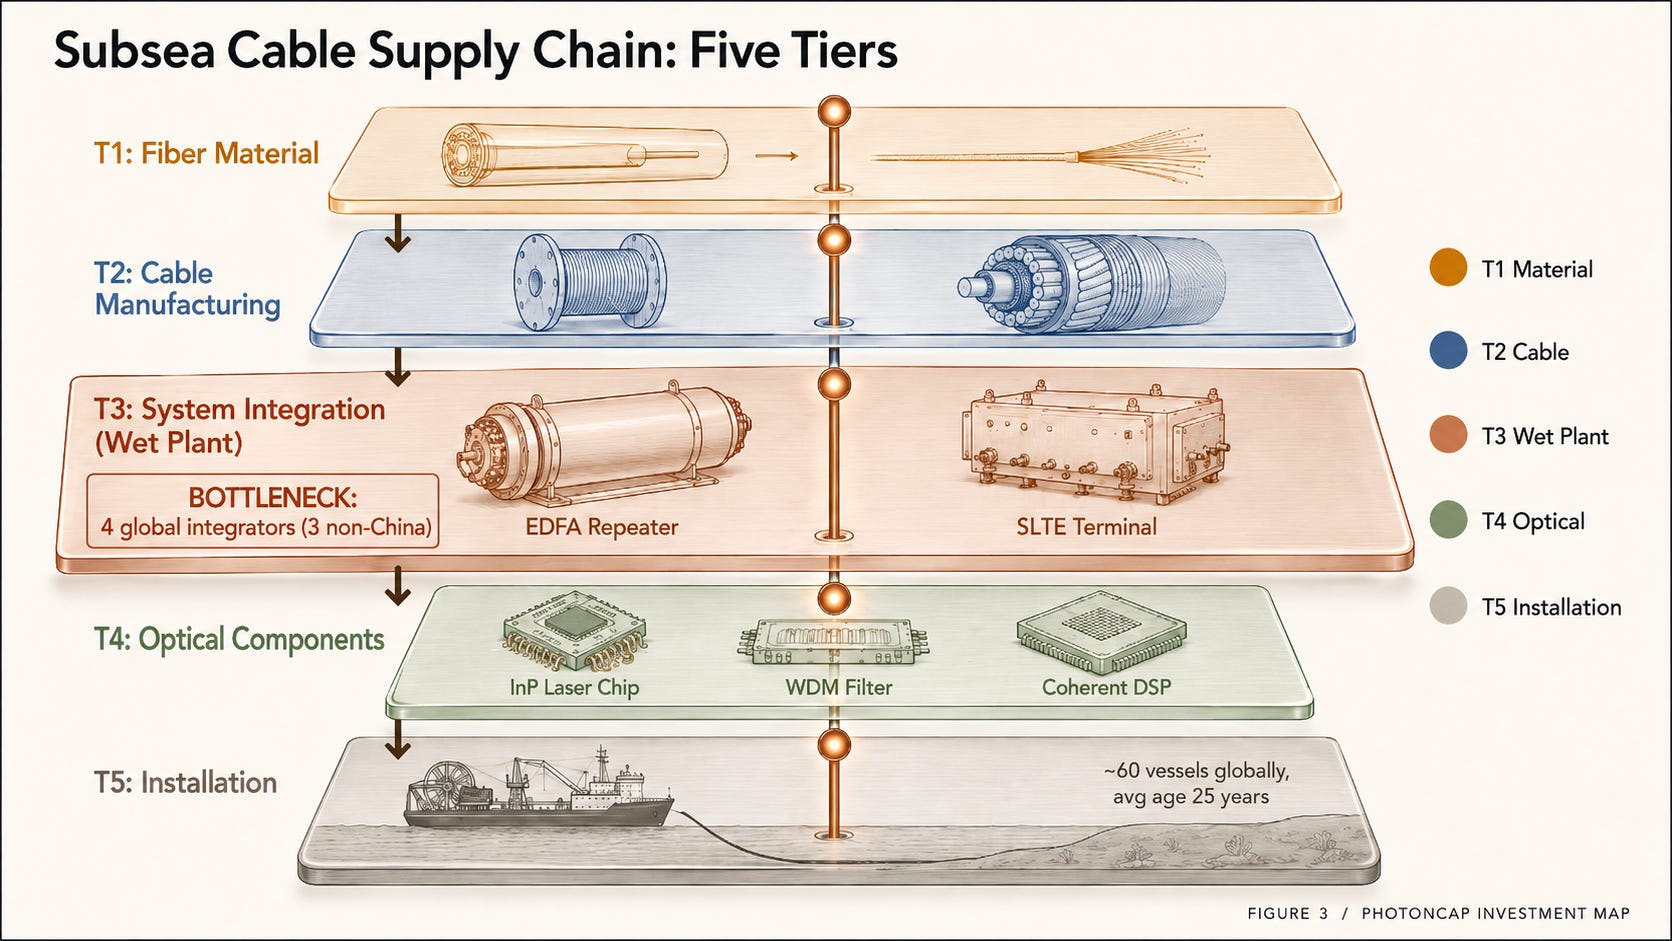
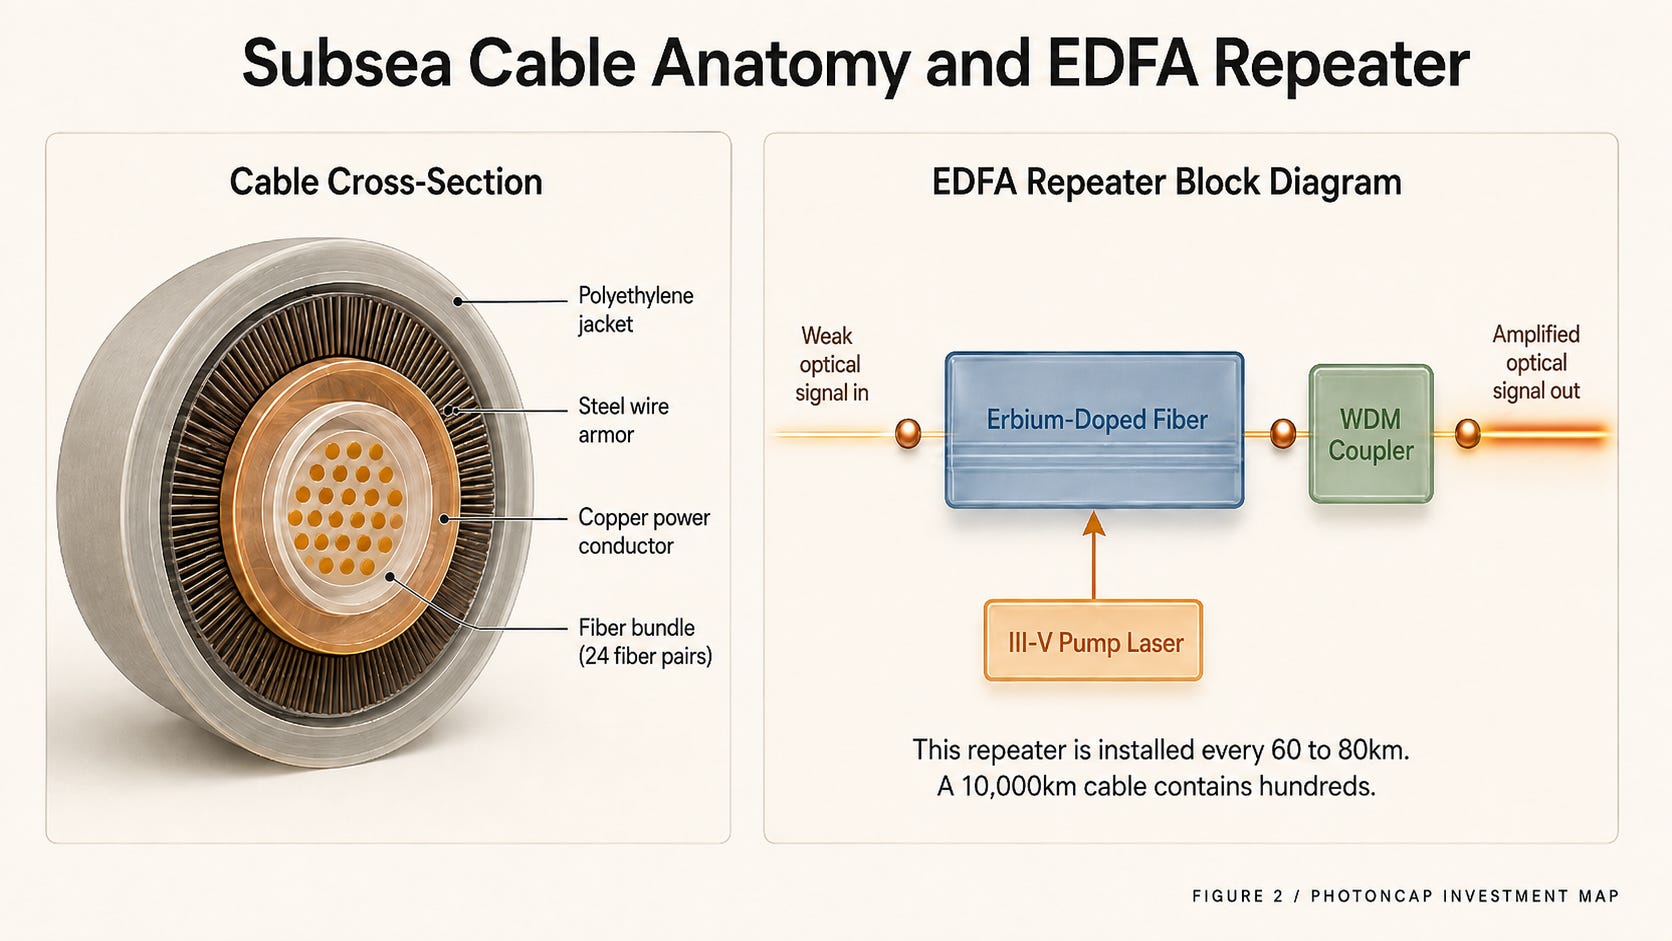
[Figure 3: Supply Chain 5-Tier Cascade (no company names, tier colors only)]
2.3 Why the cycle is happening now
Three forces are converging to create the largest subsea cable cycle in a decade.
First, AI training traffic. Distributed training demands bandwidth connecting data centers across continents. Existing cables cannot keep up.
Second, hyperscaler self-ownership. A decade ago, telecom consortia split the cost. Today Google, Meta, and Amazon individually invest billions to build and own proprietary cables [1][9]. Meta’s Waterworth ($10B+) is Meta’s first single-owner global-scale cable [7].
Third, subsea cables are being reclassified as national security infrastructure. European governments are directly nationalizing subsea cable assets. France acquired a major system integrator’s submarine business from a global telecom equipment company for €350M in December 2024 [13][14]. Italy received EU approval in April 2026 to acquire a domestic telecom operator’s subsea cable subsidiary (operating 600,000+ km of global network) for €700M [30][31]. Japan has begun reviewing subsidy support for new cable-laying vessel construction [5]. NATO launched “Baltic Sentry” in January 2025 to protect Baltic Sea cables [2].
Subsea cables are being reclassified at the level of energy and transportation infrastructure. This creates demand for alternative routing beyond existing paths, driving total order volume higher.
One more factor. Telecom subsea cables are not the only users of cable-laying vessels. Offshore wind, cross-border interconnectors, and HVDC subsea power cables all compete for the same offshore installation capacity, vessel slots, burial tools, and skilled operator pools [33]. AI data centers require not just communication backbone but power grid as well, and offshore wind and interconnector projects eat into the same cable-laying vessel schedule. In other words, the vessel bottleneck is not just an “AI traffic” bottleneck. It overlaps with AI power infrastructure.
These three factors combined are projected to grow the subsea cable market from $14.9B in 2025 to $26.4B by 2031 (CAGR 10%) [12].
Key takeaway: the drivers are AI traffic, hyperscaler self-ownership, and national security reclassification, all converging simultaneously. The cable-laying vessel bottleneck overlaps with HVDC power infrastructure. Listed investor access concentrates in T1 (Material), T2 (Cable), and T4 (Optical Components). There is exactly one listed path into T3, but it sits buried inside a conglomerate, largely invisible to the market.
3. GVM Framework + Where the real difference begins
Everything above can be assembled from public sources. Surging subsea cable demand. A narrow bottleneck. The picture is clear.
This article scores 8 listed companies across the supply chain using the PhotonCap GVM (Global Value Map) 5-axis framework. This is the subsea cable edition of the same framework used as PB/CQ/CR/OP/MA in the glass substrate map and TB/PQ/BR/LM/MO in the LEO satellite map.
[Investment Map] 15 Companies in the Glass Substrate Cycle: From Material to Mass Production
![[Investment Map] 15 Companies in the Glass Substrate Cycle: From Material to Mass Production](https://substackcdn.com/image/fetch/$s_!3Hj1!,w_1300,h_650,c_fill,f_webp,q_auto:good,fl_progressive:steep,g_auto/https%3A%2F%2Fsubstack-post-media.s3.amazonaws.com%2Fpublic%2Fimages%2Fef44434b-7610-45ea-a7bc-00f695710237_1704x923.png)
For the past 30 years, high-performance CPU/GPU package substrate stacks have been built almost entirely on organic build-up substrates, specifically ABF (Ajinomoto Build-up Film) variants. 2026 is the first year glass substrates cross from R&D into pilot/qualification phase. Intel has committed to a “second half of this decade” production window [1], TSMC is reportedly preparing its CoPoS pilot line for mid-2026 completion [2], and Absolics has entered AMD certification at its Georgia Covington fab [3]. This article evaluates 15 publicly traded companies across six countries using a glass-substrate-specific GVM Score (5-axis framework), maps them to a 4-tier cascade, and distributes them across a 12-month Catalyst Calendar. Identification, mapping, and scenario analysis for all 15 companies are covered in the paid section.
[Investment Map] 26 Companies in the LEO Satellite Cycle: From Deployment to Service
![[Investment Map] 26 Companies in the LEO Satellite Cycle: From Deployment to Service](https://substackcdn.com/image/fetch/$s_!lPvt!,w_1300,h_650,c_fill,f_webp,q_auto:good,fl_progressive:steep,g_auto/https%3A%2F%2Fsubstack-post-media.s3.amazonaws.com%2Fpublic%2Fimages%2Fc1928833-682c-4872-9ef1-c3bf54eb9fca_1704x893.png)
LEO mega-constellations are moving from a “deployment phase” to a “service phase.” Amazon Leo (formerly Project Kuiper) began its enterprise preview in November 2025 and confirmed a mid-2026 commercial launch [1][7]. AST SpaceMobile received FCC commercial authorization for its 248-satellite direct-to-device constellation [2]. Starlink operates an active constellation of roughly 10,000 satellites by tracker count [3]. This piece evaluates 26 listed names spread across nine or more countries (North America, Europe, Korea, Japan) using a satellite-comm-cycle-specific 5-axis GVM Score, maps them onto a 4-tier cascade, and distributes them across a Catalyst Calendar through the end of 2027. Identification, mapping, and scenario analysis for the 26 names are covered in the paid section.
GVM 5-axis definition (subsea cable)
TB (Technology Bottleneck): How many companies can replace this role. 5 = fewer than 3 qualified suppliers globally. 1 = 10+ alternatives.
SC (Subsea Concentration): Subsea cable revenue as a percentage of total revenue. 5 = 40%+. 1 = below 5%.
BV (Backlog Visibility): Subsea-related backlog coverage in years. 5 = 3+ years. 1 = below 1 year.
VI (Vertical Integration): Number of supply chain tiers simultaneously covered. 5 = 3+ tiers. 1 = single narrow tier.
CP (Customer Pricing Power): Bargaining power versus hyperscalers/system integrators. 5 = sole source, high switching cost. 1 = commodity, multiple alternatives.
Phase weighting
Current phase: “hyperscaler simultaneous ordering + vessel/wet plant shortage”
Heavy (x1.5): TB, CP. In a bottleneck phase, irreplaceability and pricing power determine alpha. Neutral (x1.0): BV, VI. Backlog visibility and integration are phase-independent. Light (x0.5): SC. Higher subsea concentration means higher beta, but mega-caps generate meaningful absolute revenue even at low SC.
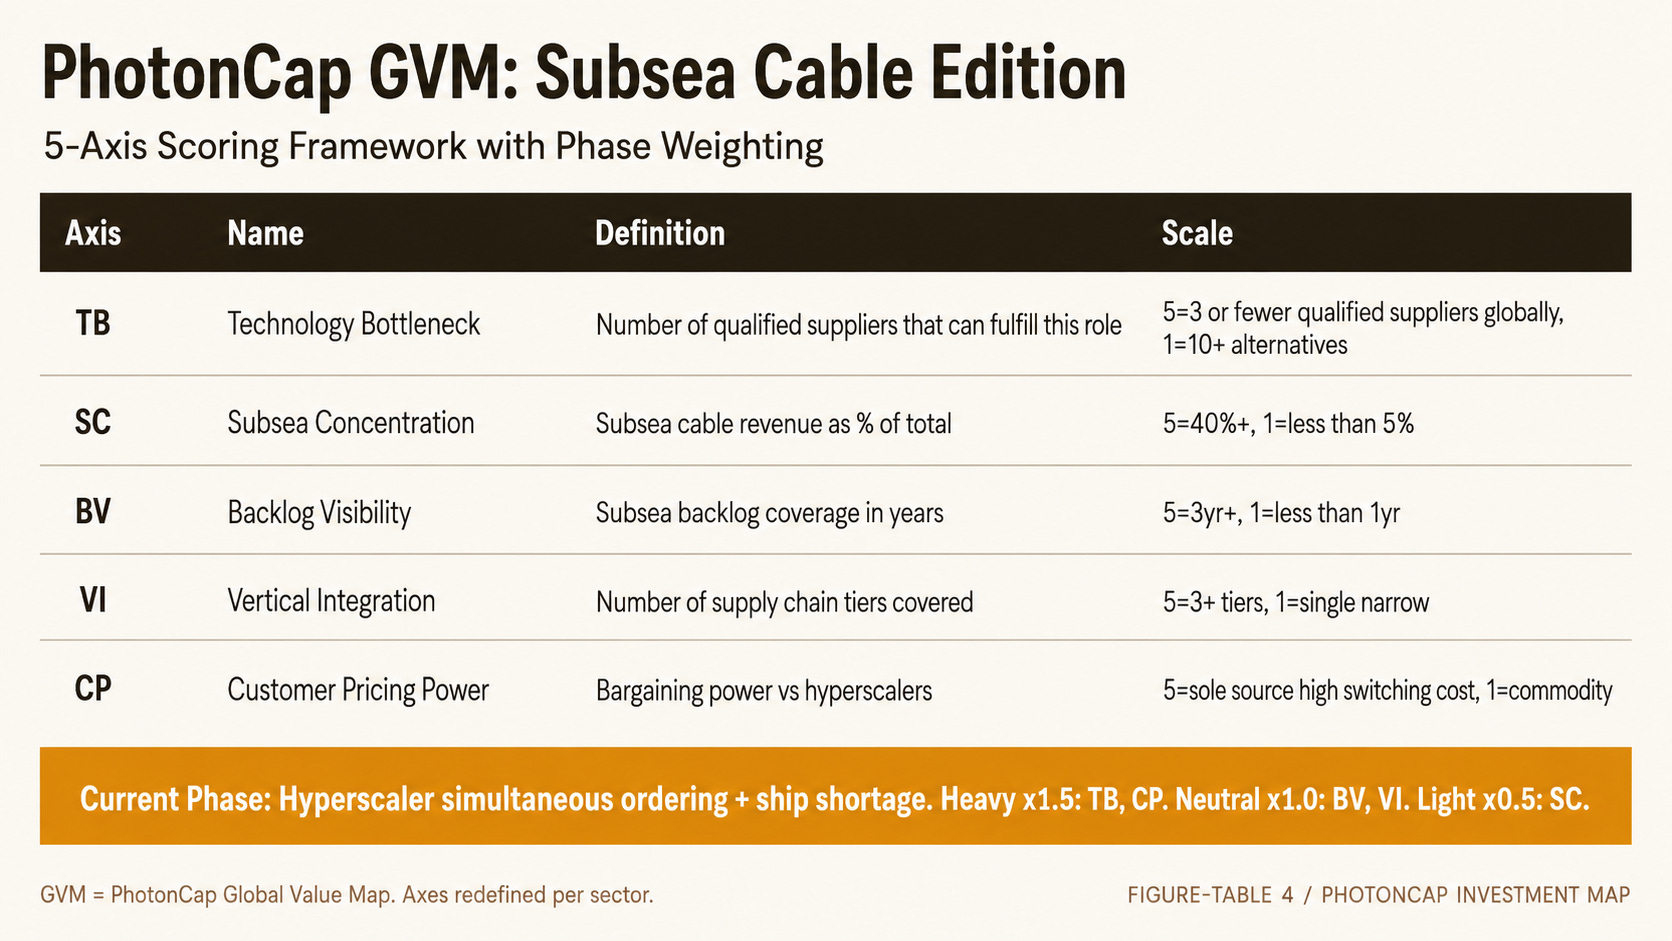
[Figure-Table 4: GVM 5-Axis Definition]
Where the real difference begins
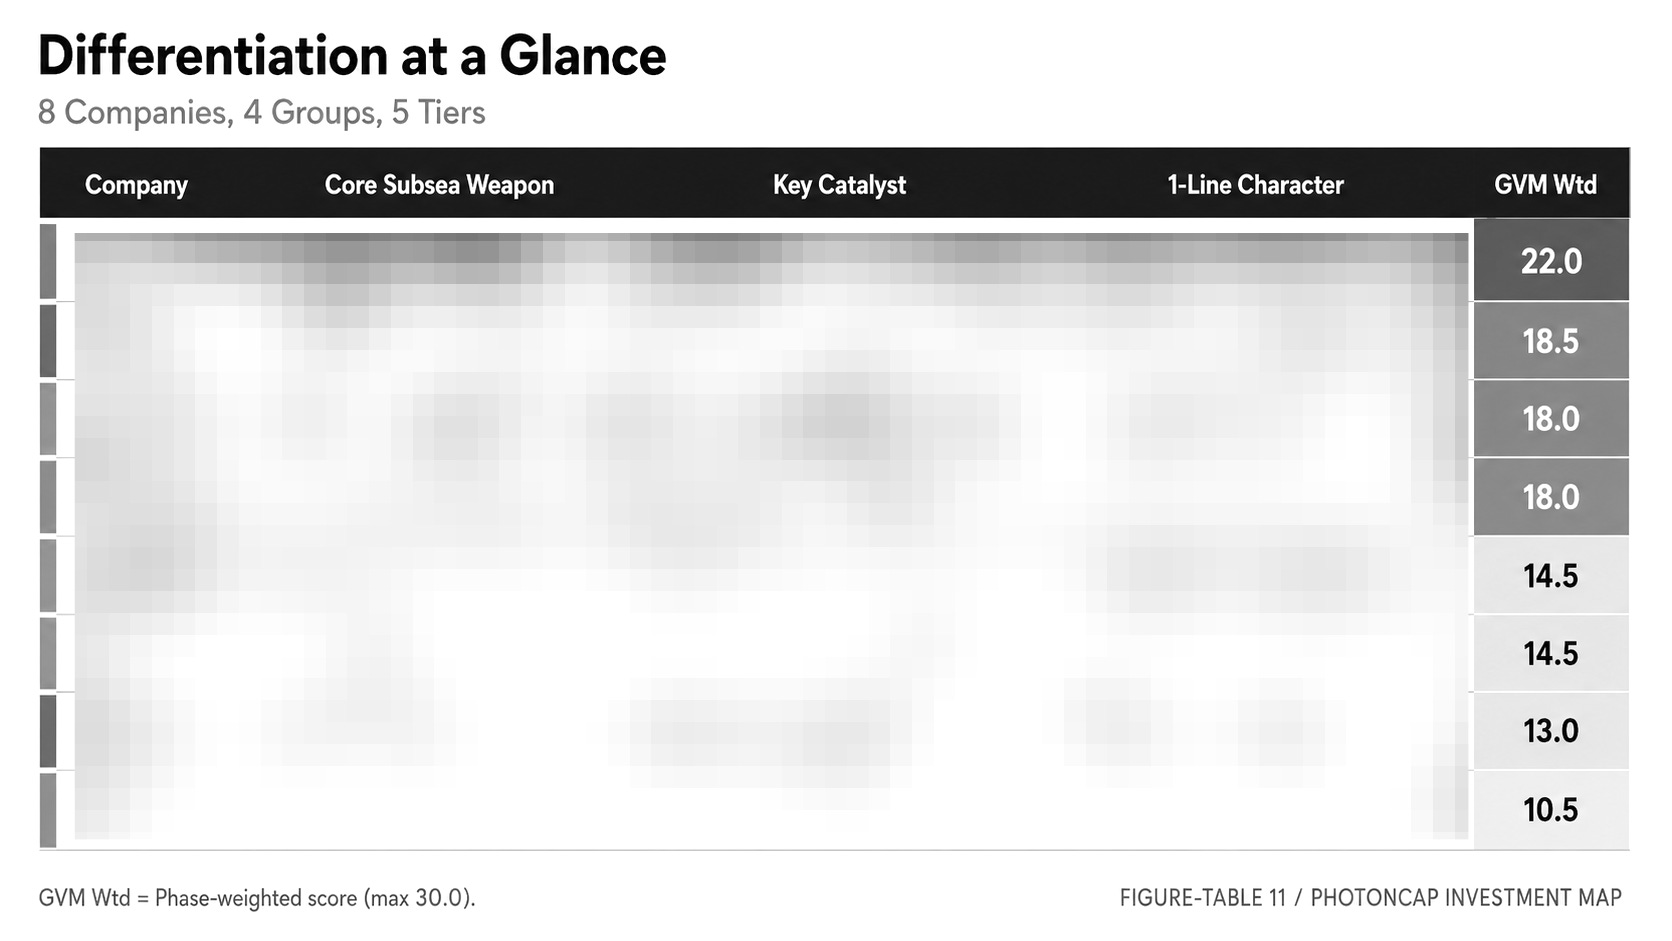
These 8 companies have fundamentally different profiles. They sort into 4 groups.
One group makes fiber and raw material. Another has vertical integration from cable manufacturing to installation. A third holds an oligopoly position in wet plant system integration. The fourth supplies optical engines and systems, from EDFA pump lasers to coherent DSP and networking equipment.
Among these 4 groups, the company with the highest GVM weighted score has received the least market re-rating. Only one company out of eight scored TB 5. That company generates single-digit percentage revenue from subsea cables, but that single-digit percentage represents a capability held by only 4 companies globally (3 non-China). While Corning rose +316% in one year and a European T2 company gained +172%, this company’s re-rating fell well short of half those figures.
Which company, and why the market has not priced it yet, is covered below the paywall.
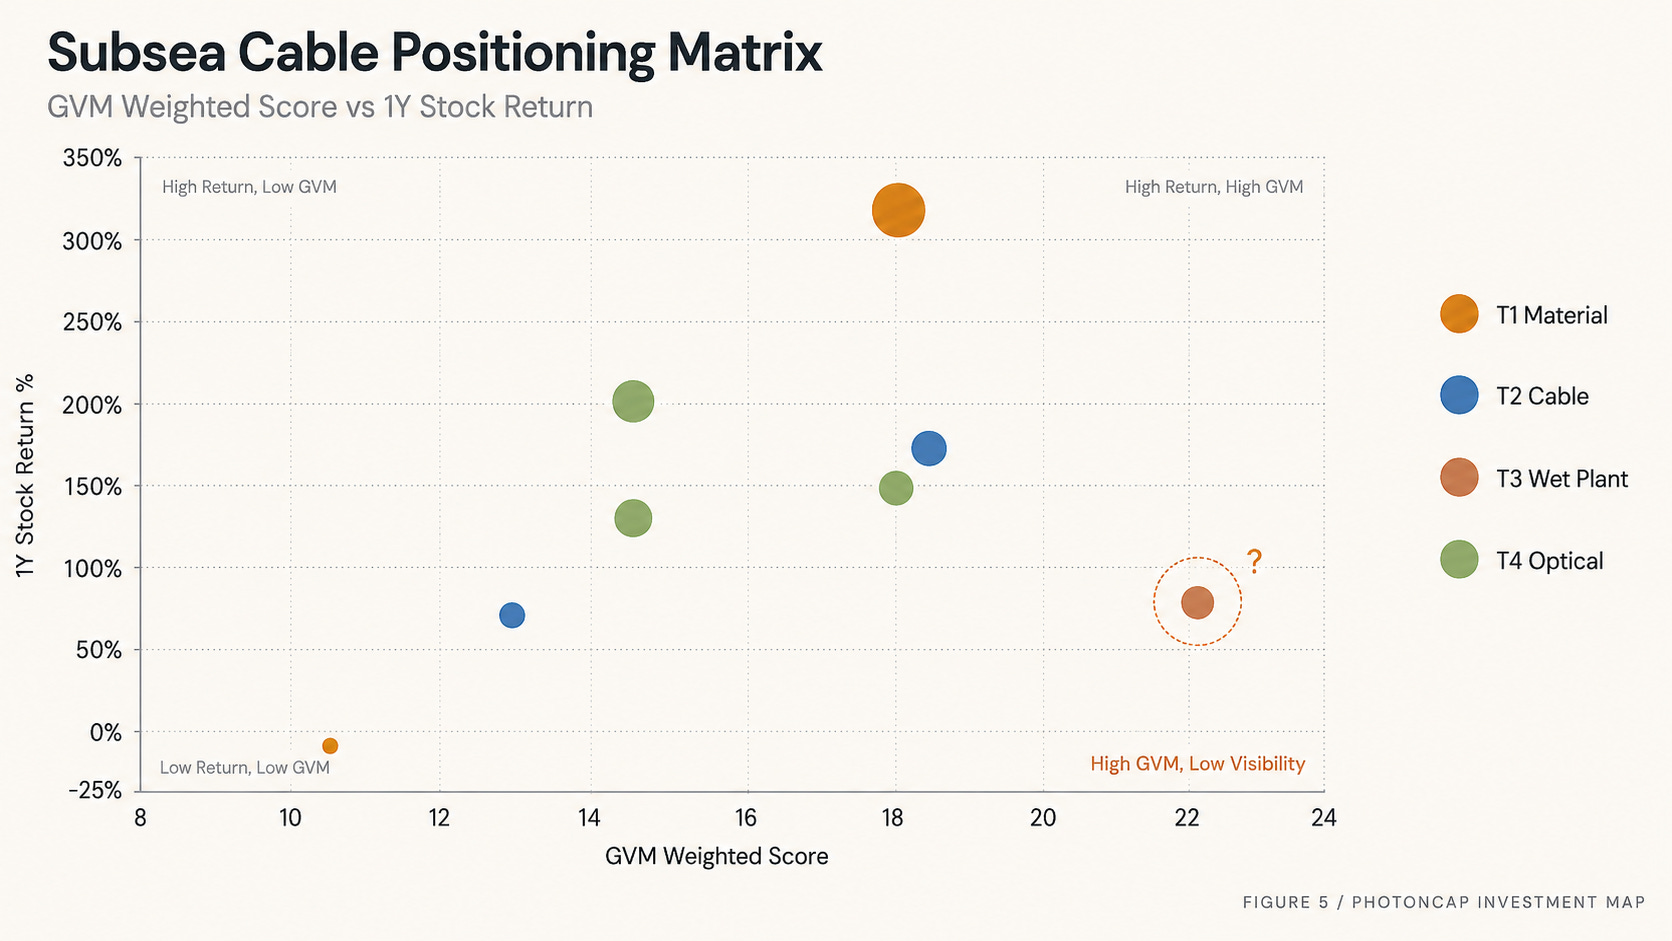
[Figure 5: Positioning Matrix, Hook Version (dots only, no names, Hidden Card dashed circle)]