
When I opened up the whole portfolio in April, I wrote that I would update it every quarter. This is the first of those updates. The trailing one year return ending August 17 is +124.25%, barely moved from the +122.29% I wrote in April. Looking at the number alone you might wonder whether anything happened at all, but the path in between was not calm at all. There was a +58% month in April and a -30% month in July. What matters more is that if you cut out just the four months, I fell behind the semiconductor index. Instead of listing the allocation table again, this piece is spent on checking and reflecting on what happened to the judgments I wrote down in April, four months later, and on comparing them against the account records. If I put down only the direction in advance, I see this quarter as the quarter where the “semiconductor” market ran ahead of me.
Contents
An Update After Four Months
The One Year Return, and the Path Underneath It
How to Read These Numbers
July: Zero Sells
The Homework April Left Behind
The 15 That Disappeared: Judgment and Raising Cash
The 8 That Came In
What the Two Snapshots Do Not Show
What Remains: Why I Still Hold Them Four Months Later
The SMH Comparison: Same Money, Same Dates
The Cost of Concentration
Conclusion
1. An Update After Four Months
On April 11 I wrote 1Y +122%: What Happens When a SiPh Engineer Only Buys What He’s Touched and disclosed all 40 or so tickers across three accounts. At the end of that piece I wrote “next update: Q3.” This is the piece that keeps that promise.
On a trailing one year basis ending August 17, the combined return across the three accounts is +124.25%. That moved about 2pp from the +122.29% I wrote in April.
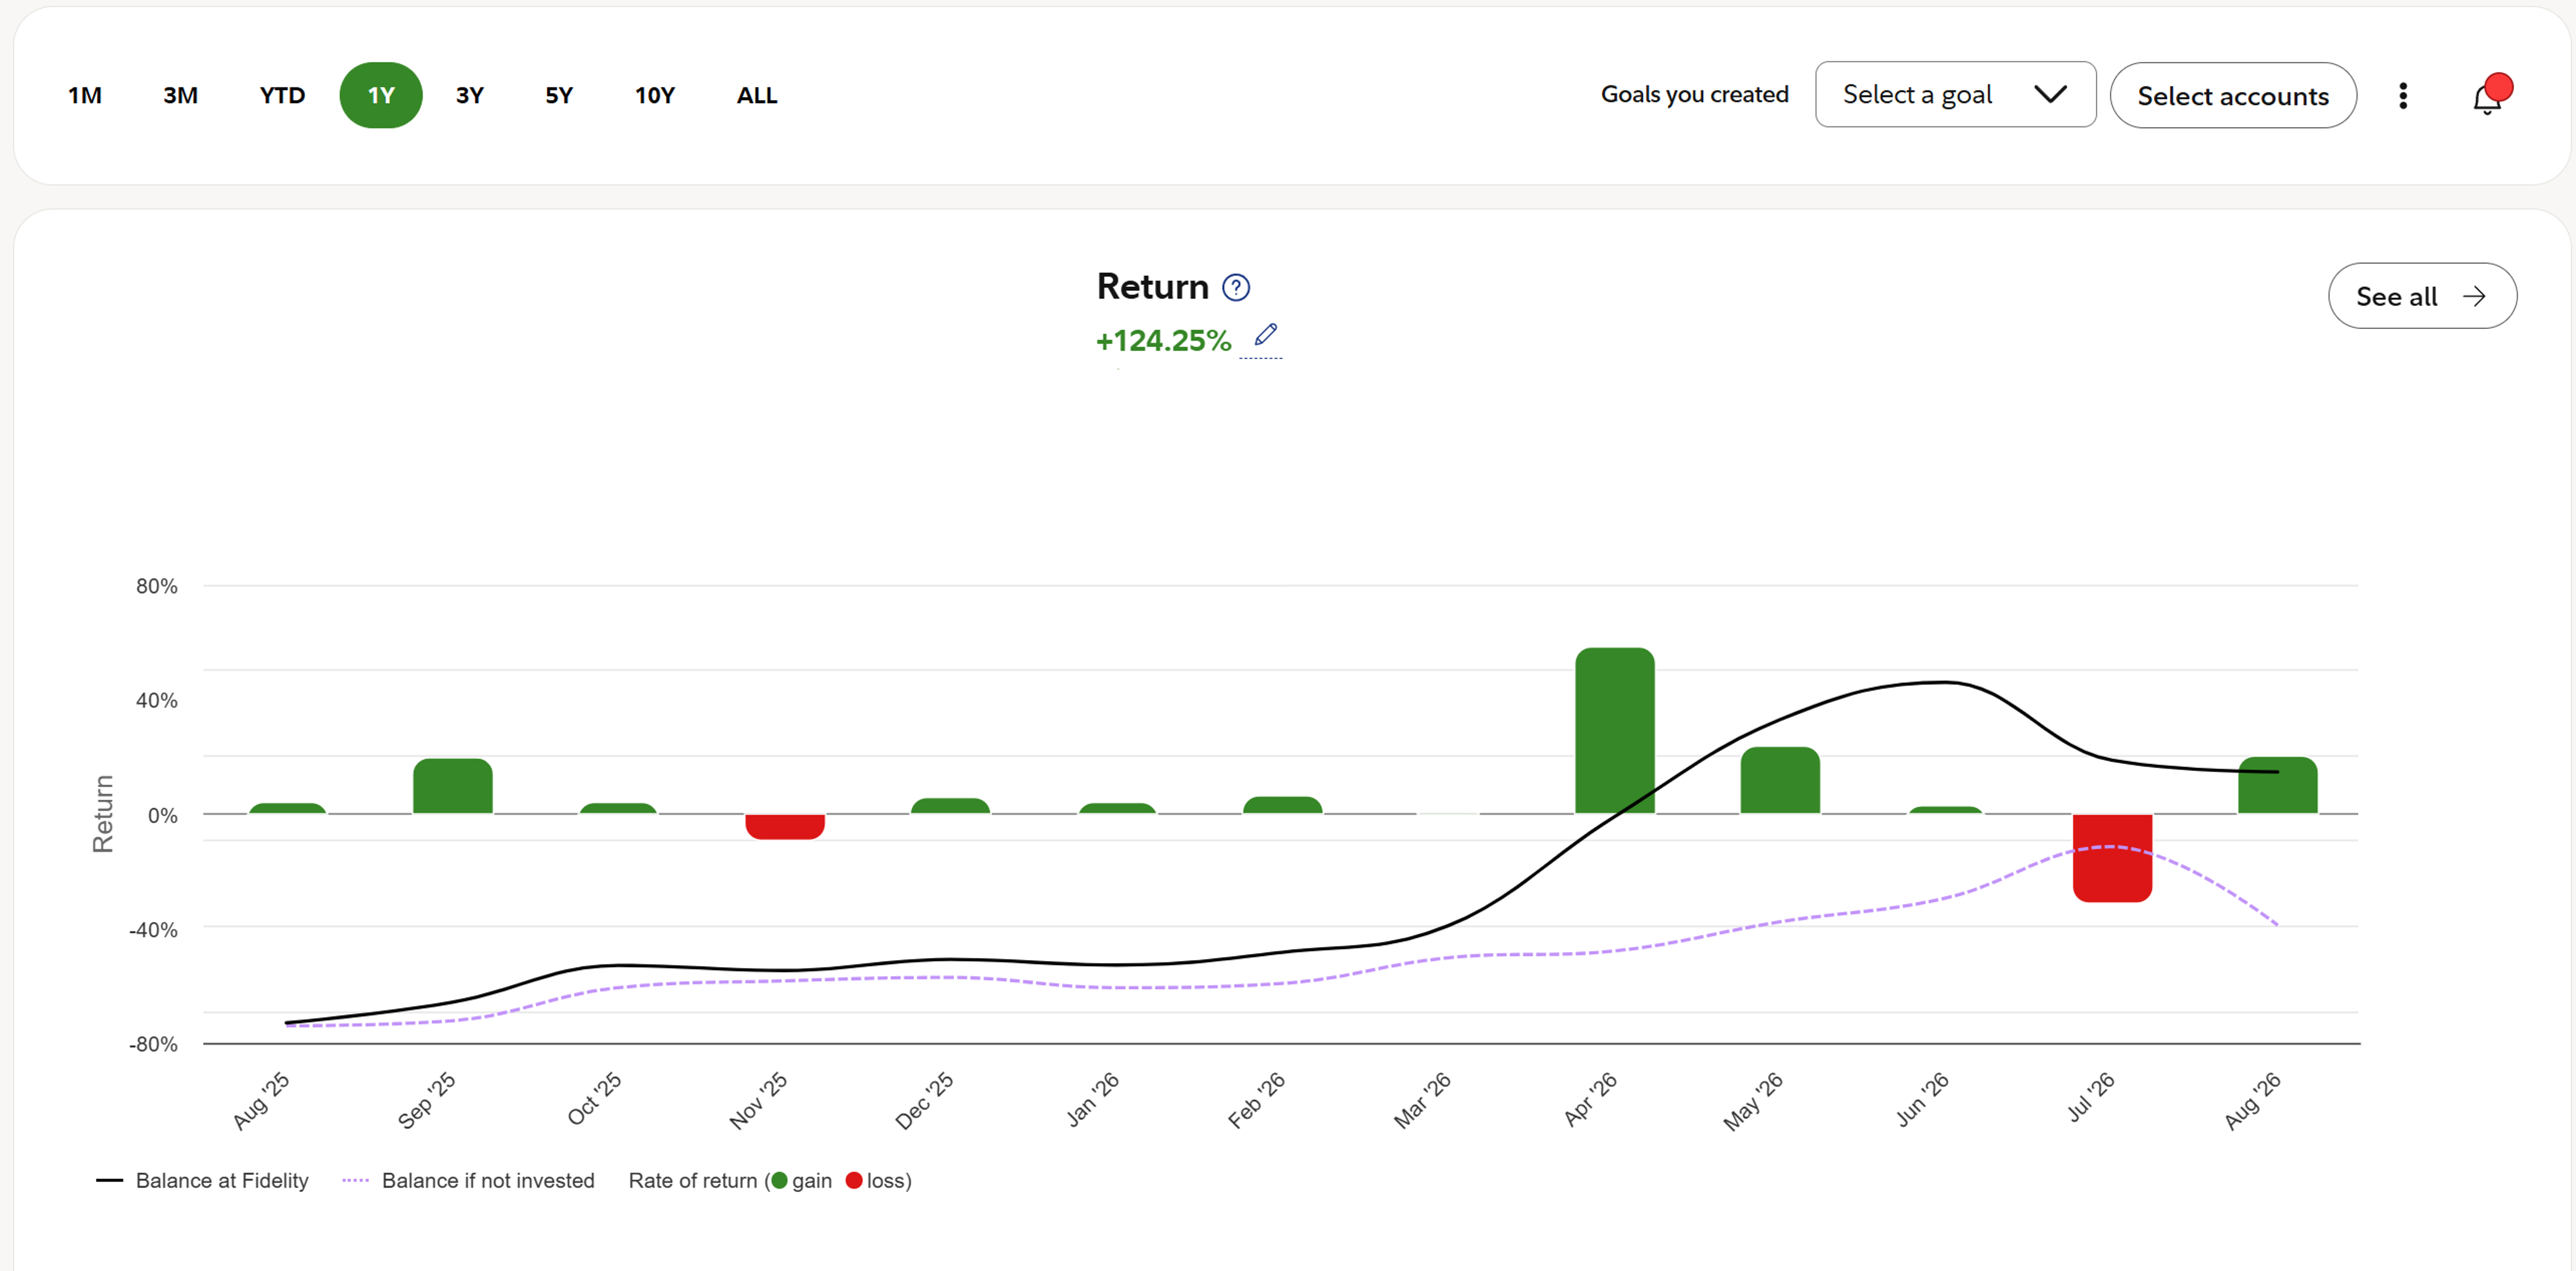
Looking at this number alone, it seems like nothing happened for four months. But open the account records and it is the opposite. So instead of walking through allocations ticker by ticker like April, this piece tries to focus on what actually happened during those four months.
So the material for this piece is the records underneath rather than the account screens. I downloaded a full year of deposits and withdrawals plus 1,600 executions, and matched them one by one against the sentences I wrote in April. Whether a ticker I said I would “keep watching” four months ago is still in the account, what orders I actually placed when the drawdown came, and whether anything came in and went out unnoticed between the two disclosures.
For reference, on August 11 and 12 I moved a bit over 20% of the accounts out to a CMA account. That was money for another purpose and it had nothing to do with a market judgment. So part of the balance curve coming down from the June high is the portion I took out. The return numbers in this piece are calculated with all of those flows stripped out.
2. The One Year Return, and the Path Underneath It
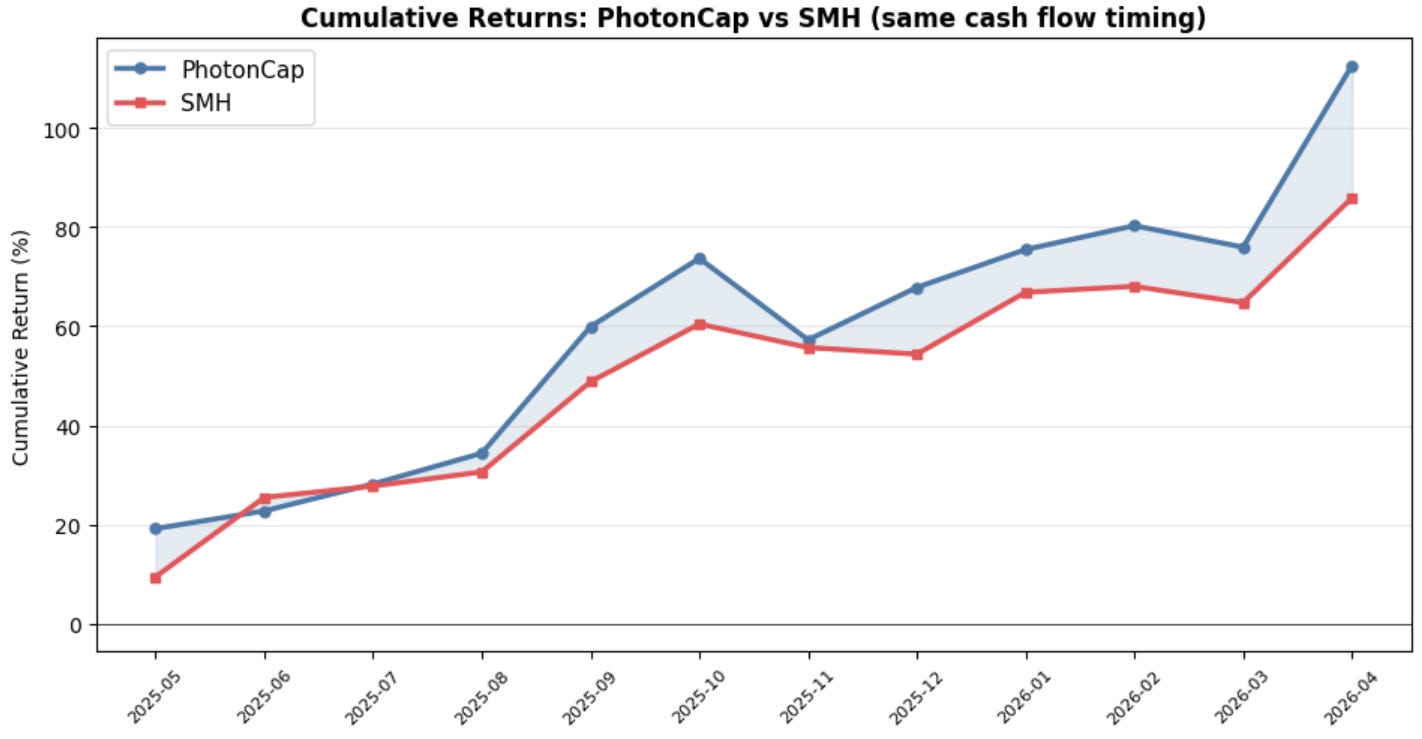
Cut month by month, it looks like this. I calculated it with the Modified Dietz method, reflecting each month’s starting balance and the money that came in and out on a daily basis, and I put SMH next to it for the same period. The window is August 1, 2025 to August 17, 2026, which is twelve and a half months.
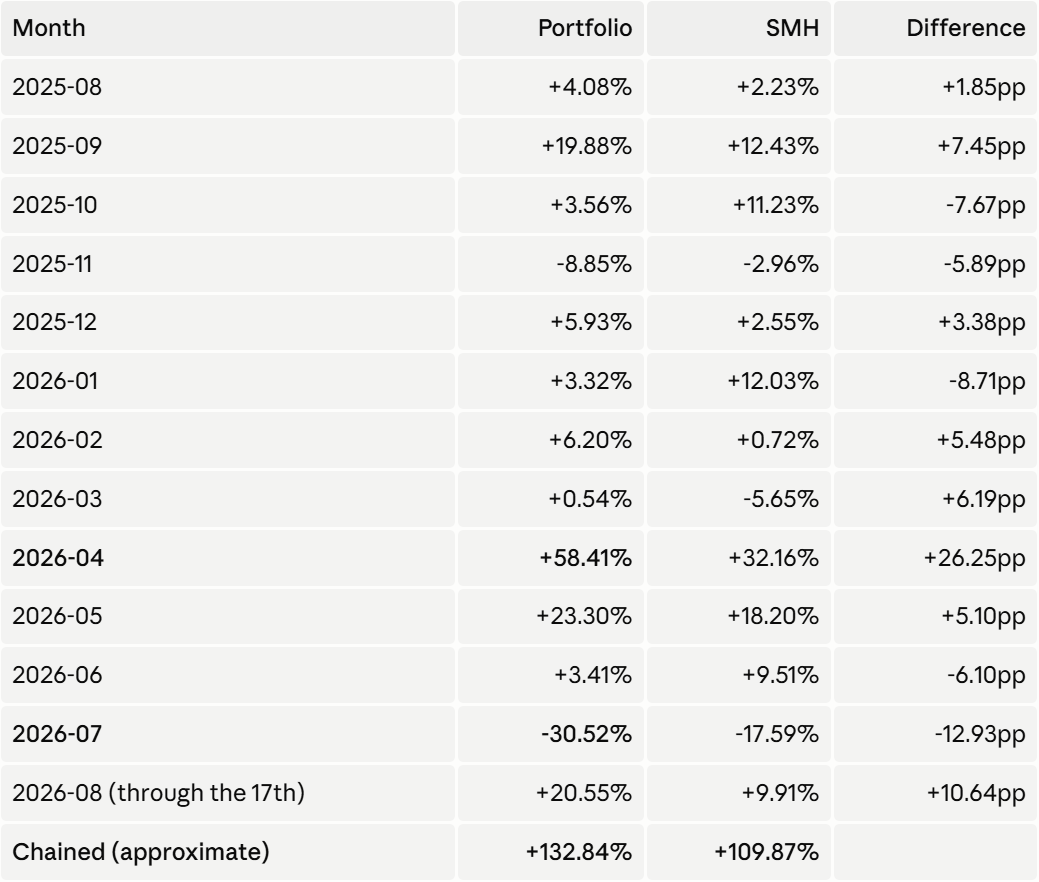
In April, 58% got added in a single month. And in July, 30% went away. In August it is in the middle of taking back 20%. Out of thirteen months, five trailed SMH.
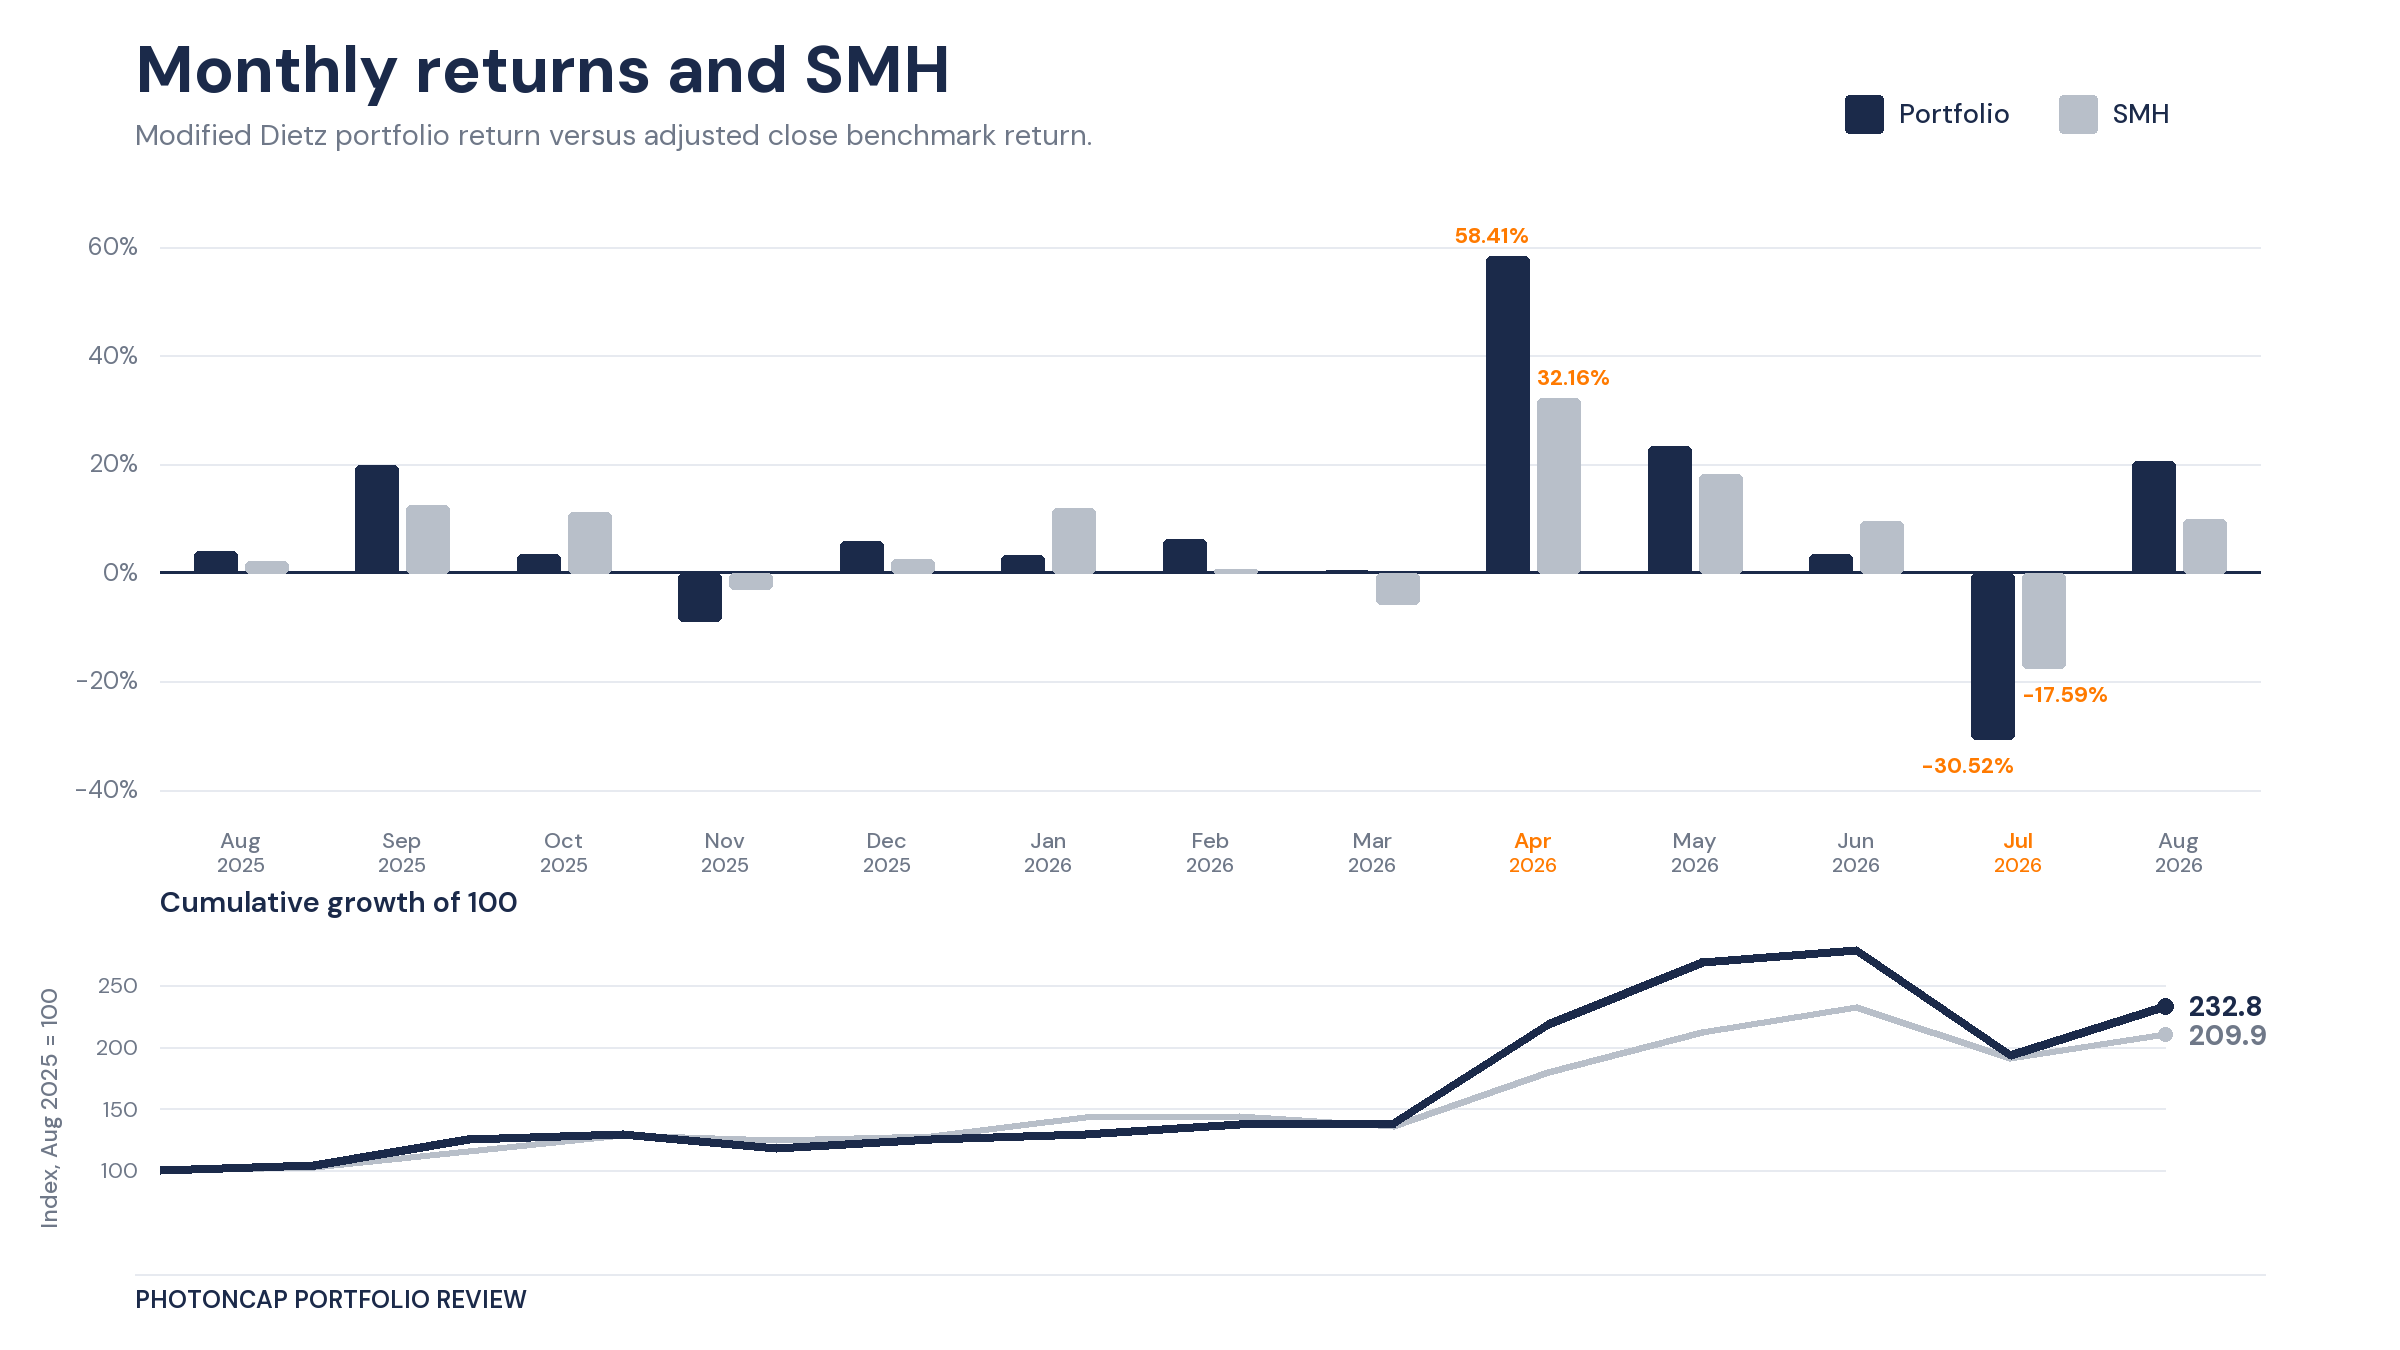
Monthly return bars and relative performance versus SMH. Cumulative curve normalized to a starting value of 100, no dollar axis
The reason the trailing one year number looked like it stood still is that these months offset each other. But this only means two trailing one year readings with different as of dates printed 2pp apart, and the actual performance over the four months has to be looked at separately. That number comes below.
April is unusually large in this table, and the April piece was published on April 11. So about halfway through that month, holding an account that had already risen a lot, I wrote “1Y +122%.” The timing of the disclosure was good, and luck played a big part in it. If you look at what happened to the same account four months later in this piece, that difference should become a little clearer.
The return summary section of the April 11 article
Over the same period, the semiconductor ETF SMH returned +109.87%. From an adjusted close of 283 dollars on August 1, 2025 to 594 dollars on August 17. It was a window where holding SMH alone and sitting still would have doubled your money. My chained return of +132.84% is a number sitting on top of that.
Two numbers show up here and it may be confusing, but the basis is different. +124.25% is the trailing one year money weighted return the broker calculates, and +132.84% is a twelve and a half month time weighted approximation from chaining the table above. The calculation method is different and the measurement window is different, so the gap between the two cannot be explained by cash flow effects alone. When comparing against SMH in this piece, I use the latter basis throughout.
If I match the basis to the monthly table and cut only from the end of April to August 17, the picture gets clearer. Part one was published on April 11, but this starts from month end, so it is a window that begins about three weeks later. Over this window SMH is +17.24% while my portfolio is +6.80%. I fell behind by 10.4pp.
The biggest cause, as you already know, is July. If you look at the difference column in the table, 12.93pp opened up in that single month, which is larger than the other three months combined. SMH also fell more than 17% in July, but my account fell more than 30%. It is a concentrated, high beta small cap optics portfolio, so it took a much bigger hit than the index, and even after taking back 20% in August it still has not closed that gap.
The conclusion of the April piece was that “concentrating in what you know beats diversifying into what you do not know,” and three months after writing that sentence, the other side of concentration arrived. If you gather names that move in the same direction, they rise together and they fall together. The fact that it fell nearly twice as much as the index probably includes some individual bad news, but the composition itself, a group of names tied to the same direction, worked in the direction of amplifying the drawdown.
The April piece ended with the sentence that it was 42pp ahead of SMH. What happened to that edge four months later is in section 10.
3. How to Read These Numbers
Before laying out more numbers, it seems right to state the calculation method first. The same account can produce different returns.
The +124.25% that shows on the broker screen is a money weighted return. When and how much you put in gets reflected in the result. Money put in during September compounded for a year while money put in during July only compounded for a month, and this method puts that difference into the calculation.
The value from chaining the table above is +132.84%. Because it links monthly Modified Dietz returns, it is an approximation of a strict time weighted return, and months where a large amount came in mid month, like July, carry some error. This one reduces the influence of deposit and withdrawal timing, but what is left is not only stock selection. Position sizing, trade timing, and how much cash was held are all mixed in.
There is a reason the two diverged by more than 8pp. I kept adding money from March through July, and it was with an account grown that large that I took a -30% month. The weight of a bad month taken with large capital late outweighed the good months made with small capital early. That is why the dollar based result comes out lower than the stock picking result.
And, in order to compare my results, I tried comparing against the semiconductor ETF SMH. This was something a subscriber requested, and I thought it was a good reference so I prepared it again this time. If the same money went into SMH on the actual deposit dates and amounts, how much would it be now. That calculation is section 10.
There is one more thing I want to write down here. There are plenty of pieces that disclose returns, but most of them cut out the good stretch and show that. I did the same in April. I announced a one year return about halfway through a month where 58% had been added in a single month. Pieces like that leave the reader with very little after reading. Either envy or suspicion, one of the two.
What I want to do this time is the opposite of that. Account records do not allow you to keep only the bragging. What orders I placed in July, what I sold two weeks after writing that I was convinced in April, how many tickers I bought impulsively while writing a piece and how those ended, all of it is there with the dates. If you lay that out as it is, good judgment and things gained by luck and plain mistakes become distinguishable from one another.
I think what is useful from the reader’s side is that distinction. This is not to say you should buy my tickers. It is about seeing, through one person’s record, how long something written down as conviction actually holds. And then when you look at your own account, you will probably see something similar.
So from here on are the things that only come out when you open more than 1,000 executions. What I did in July, why the 15 tickers that were there in April disappeared, what trades do not show up in either of the two snapshots, and why I still hold the 35 that remain.
