
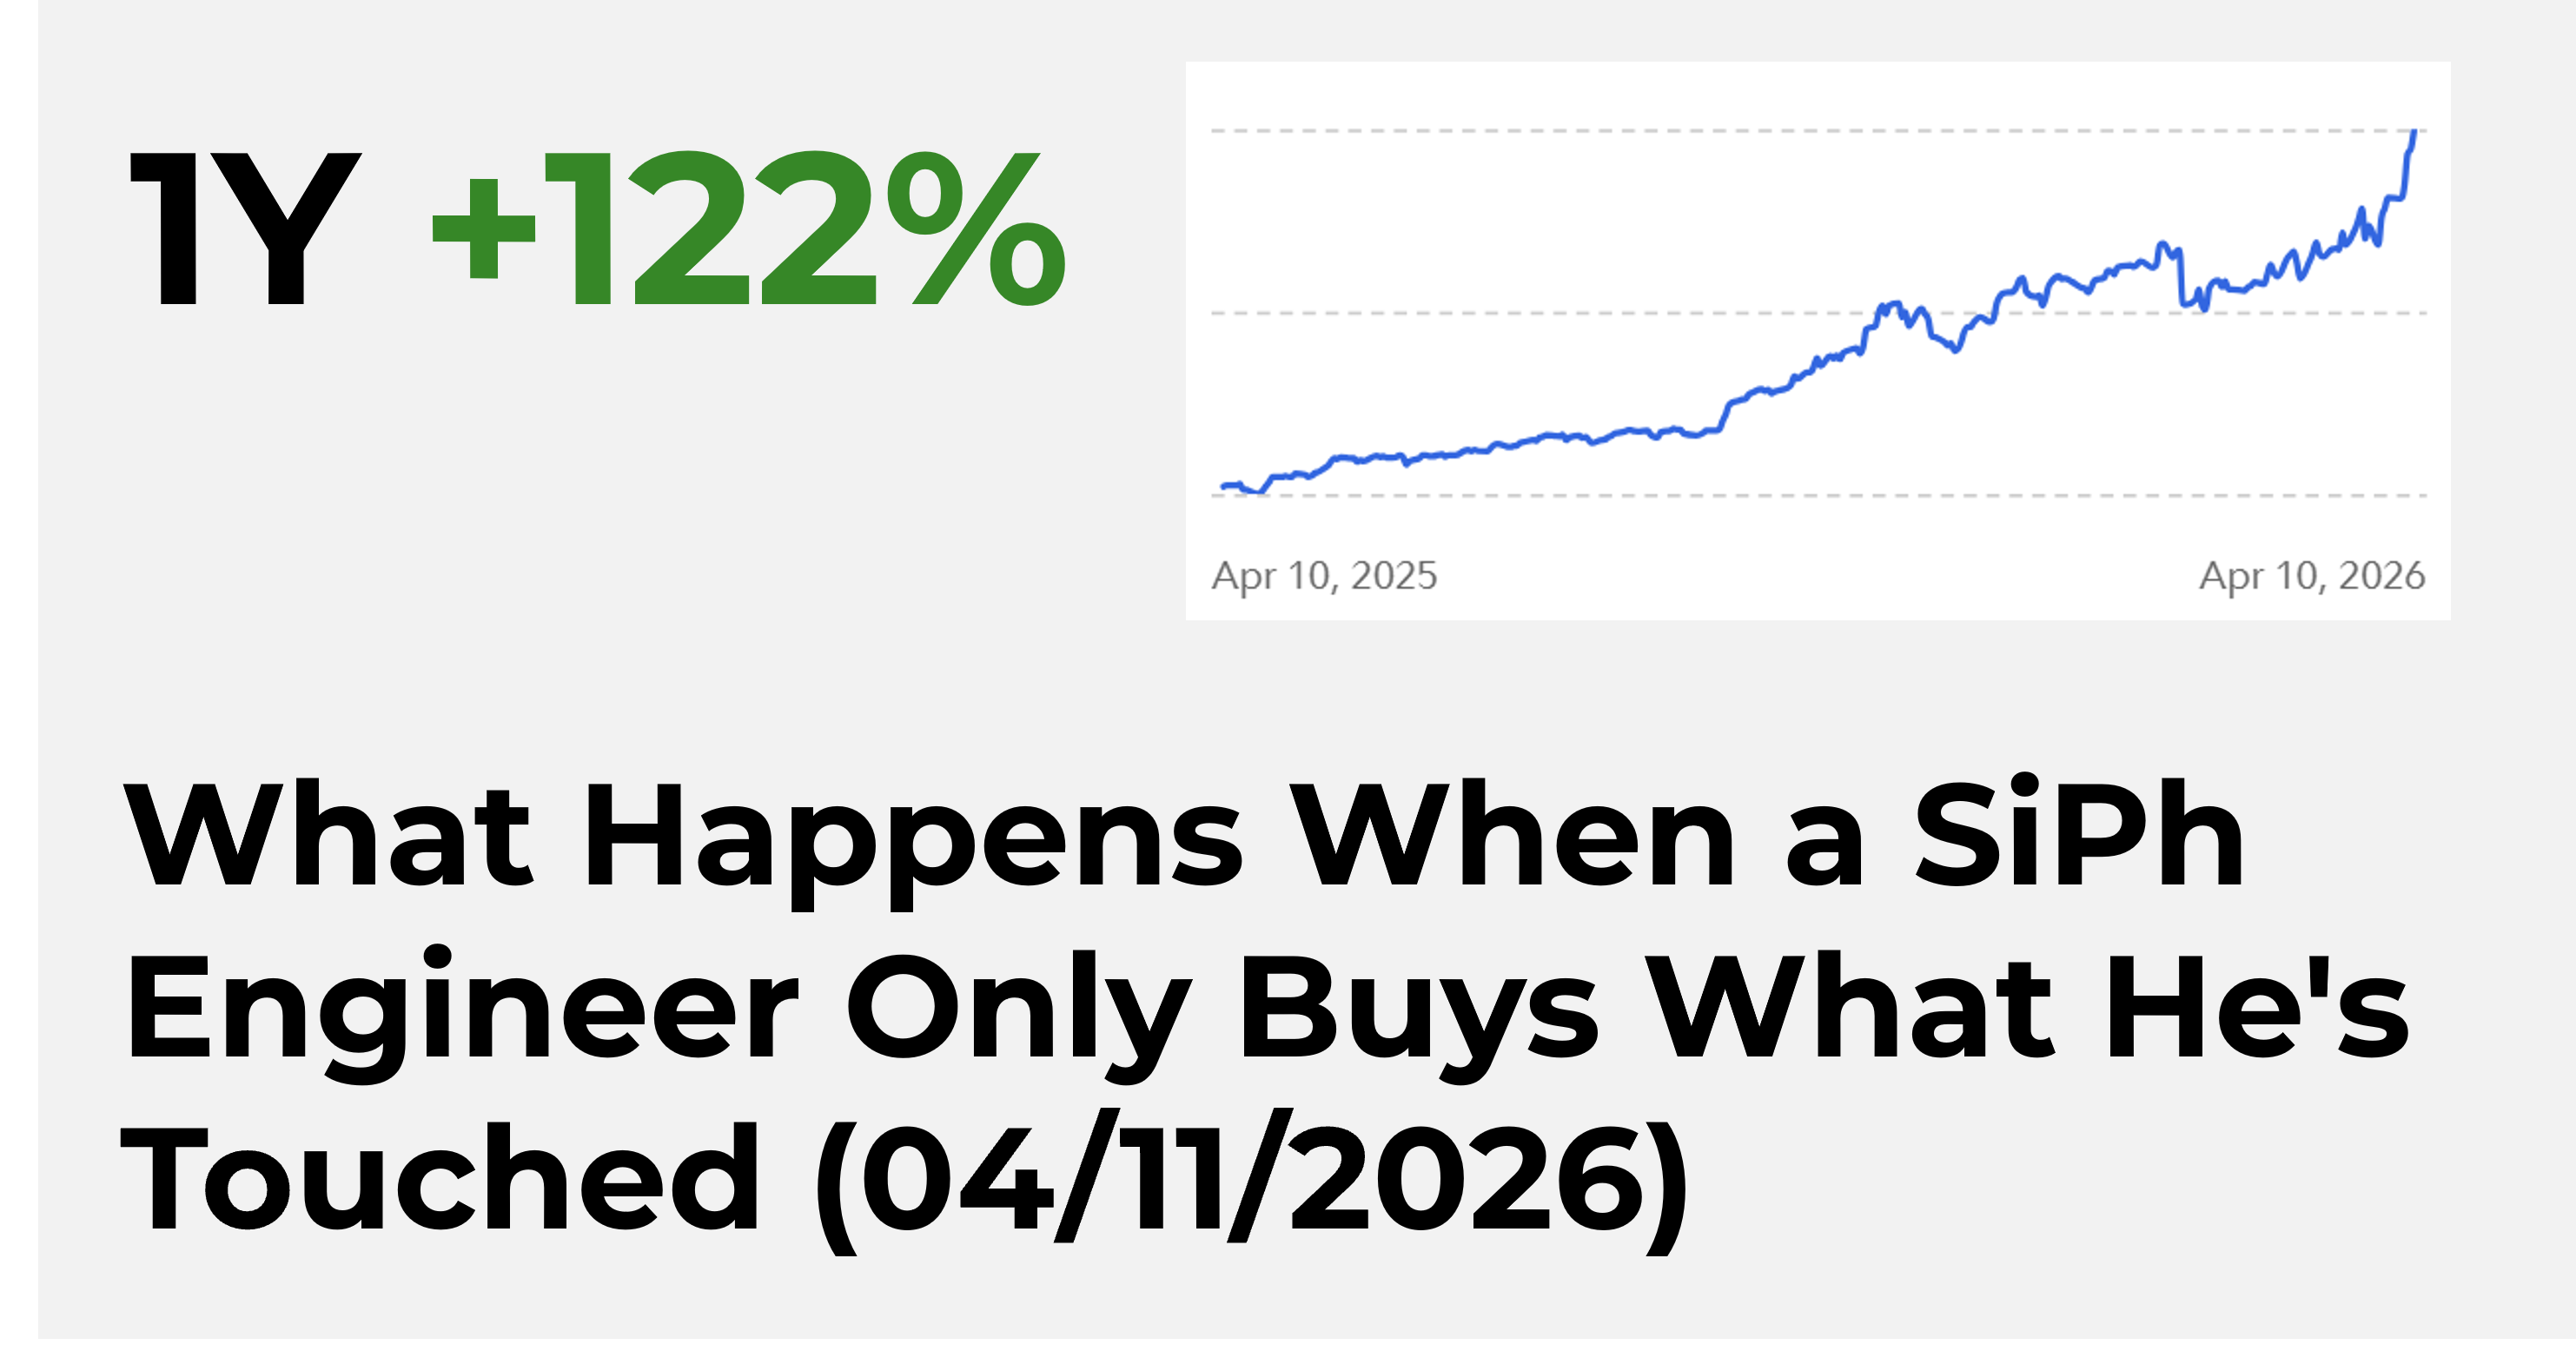
1Y +122%: What Happens When a SiPh Engineer Only Buys What He's Touched (04/11/2026)

Disclaimer: This article is an independent, engineering-driven technical analysis published by PhotonCap. The author is a practicing engineer in the photonics/semiconductor industry. All analysis is based solely on publicly available information such as earnings calls, press releases, SEC filings, academic papers, and industry publications. No material non-public information (MNPI) was used in the preparation of this article or in any investment decision. Nothing herein constitutes a recommendation to buy, sell, or hold any security. Past performance does not guarantee future results. The author may hold positions in securities discussed and may transact at any time without notice. Readers should conduct their own due diligence before making any investment decisions.
Abstract
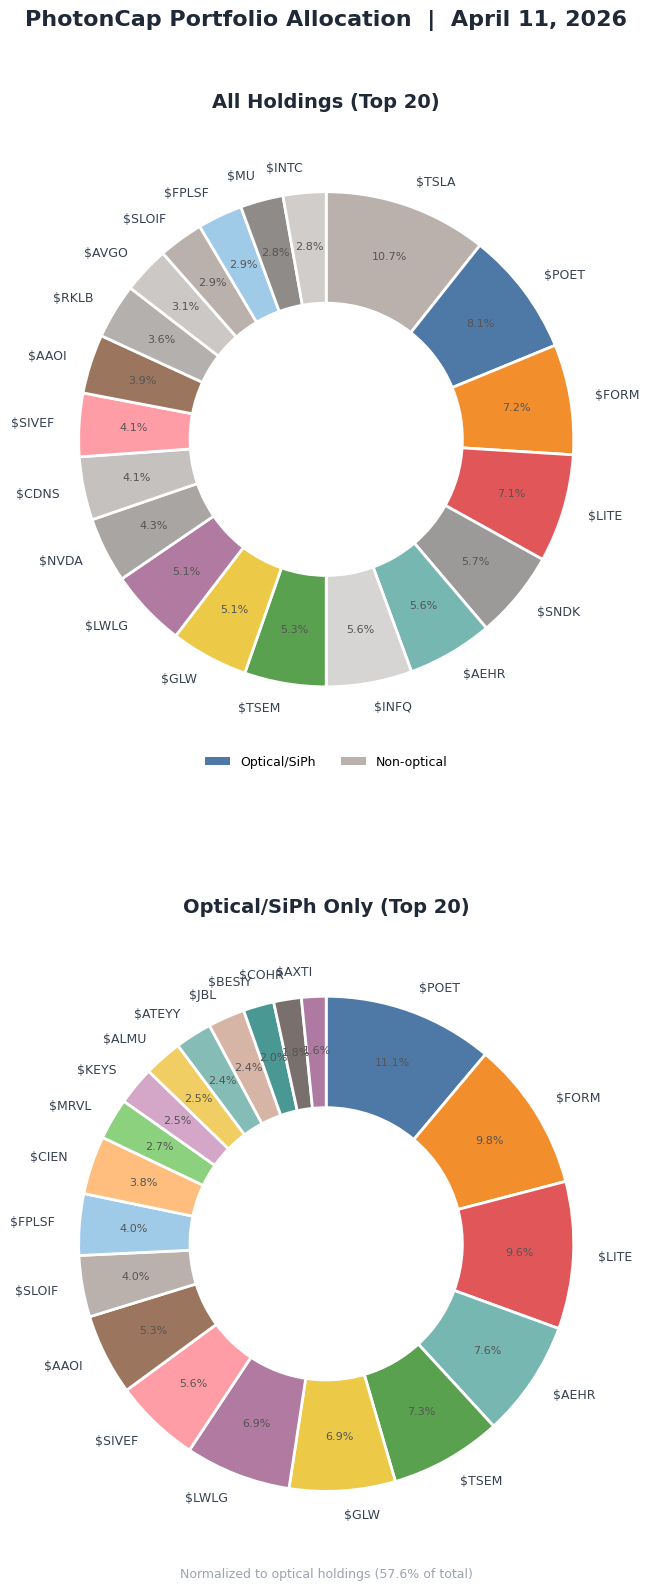
A full snapshot of the PhotonCap portfolio. Across three brokerage accounts holding ~40 tickers, silicon photonics and optical value chain names make up roughly 58% of total holdings, with a combined 1-year return of +122.29%. This article breaks down each position’s weight, return, and the reasoning behind every buy. Total dollar amounts are not disclosed. Only allocation percentages and returns are shared. (Retirement accounts are managed separately with index funds like VOO and QQQ, and are not covered here.)
Tickers: $POET, $LITE, $FORM, $AEHR, $LWLG, $COHR, $GLW, $MRVL, $TSEM, $SIVEF, $AAOI, $CIEN, $KEYS, $AXTI, $SLOIF, $BESIY, $GFS, $ALMU, $IQEPF, $FPLSF, $HIMX, $VIAV, $ATEYY, $TER, $VECO, $LPTH
My thanks to the community members, subscribers, and followers who have engaged and shared insights across X, PIC community, and Substack. Special thanks to Mooni Insight (@Semicon_player) and Serenity (@aleabitoreddit) on X for the inspiration.
Contents
Why I’m Opening Up the Portfolio
Portfolio Overview
Account Breakdown
Optical Value Chain: Position by Position (paid)
Test & Measurement Layer: The New Additions (paid)
Non-Optical Names: Why I Own Them (paid)
What I’m Still Debating (paid)
Closing
References & Sources
1. Why I’m Opening Up the Portfolio
The most common question I get running PhotonCap is: “So what do you actually own?”
Fair question. I write deep-dives on SiPh companies, so if you don’t know what I’m buying, half the context is missing. So here it is. All of it. I’m not disclosing total dollar amounts, because where you allocate and how much weight you put on each name tells you far more about conviction than raw numbers do.
The short version: roughly 58% of my portfolio sits in optical/SiPh value chain names. The 1-year return across all three accounts is +122%. The account that’s most concentrated in SiPh names returned +196%. The remaining 42% is semiconductor large-caps, small quantum computing positions, and cash.
One thing worth mentioning upfront: these three accounts are all individual brokerage accounts. My retirement accounts are separate and run on index funds, VOO, QQQ, that kind of thing. Low-maintenance, long-horizon, set-and-forget. What this article covers are the accounts where I pick individual names and size positions by conviction.
Starting with this article, portfolio reviews will be updated quarterly for paid subscribers. What got added, what got trimmed, how weights shifted, and an honest look back at whether the previous quarter’s calls were right or wrong.
2. Portfolio Overview
I hold about 40 tickers across three Fidelity brokerage accounts.
Summary (as of April 11, 2026)
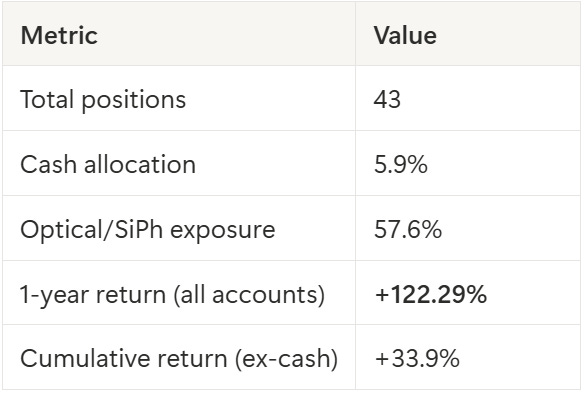
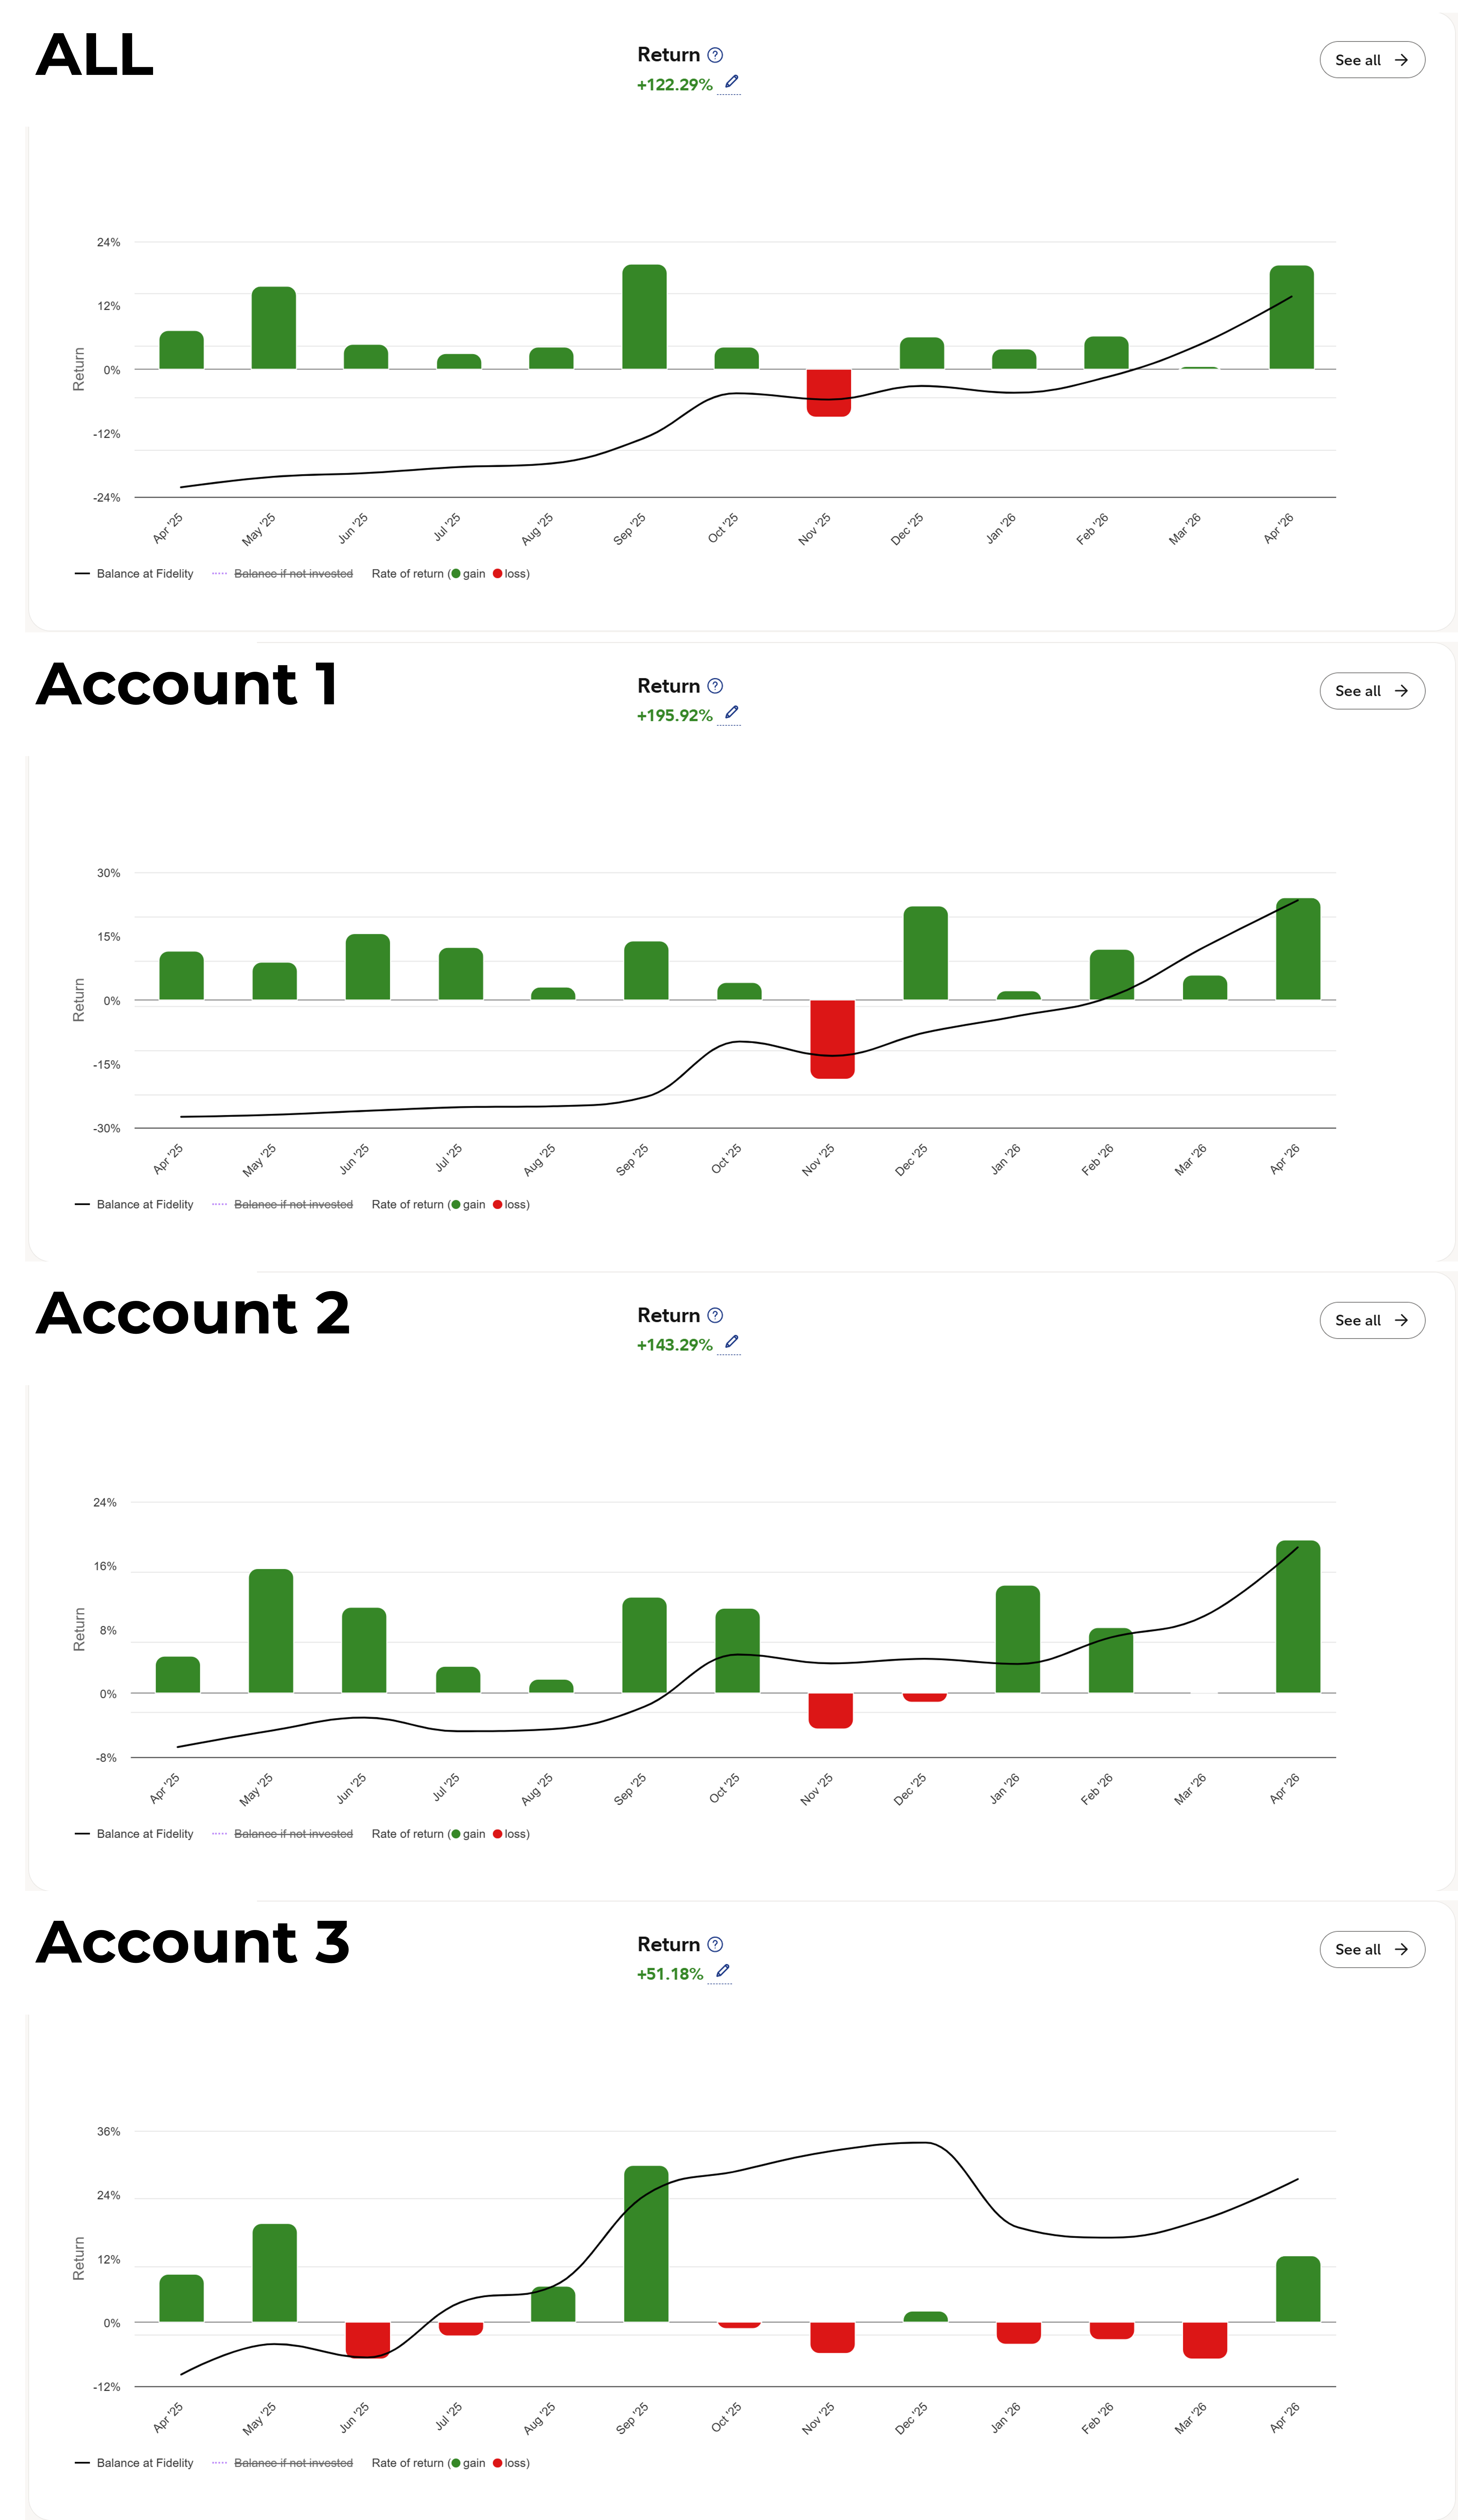
1-Year Returns by Account
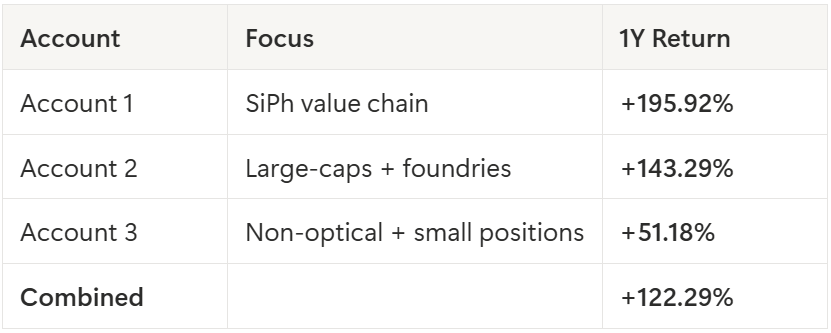
The correlation between optical concentration and returns is pretty clear. Account 1, which is almost entirely SiPh names, did +196%. Account 3, where non-optical names like $TSLA and $INFQ dominate, did +51%.
A note on reading these return numbers. These accounts were opened roughly three years ago, and I’ve added significant capital throughout this year in particular. That’s why the cumulative return (+33.9%) looks much lower than the 1-year return (+122%). The recent capital injections inflate the denominator in the cumulative calculation. Is the 1-year number a better measure of skill, or is the cumulative number more honest? Both are true and both are incomplete. I’m publishing both because I think that’s the fair thing to do.
Top 20 Holdings
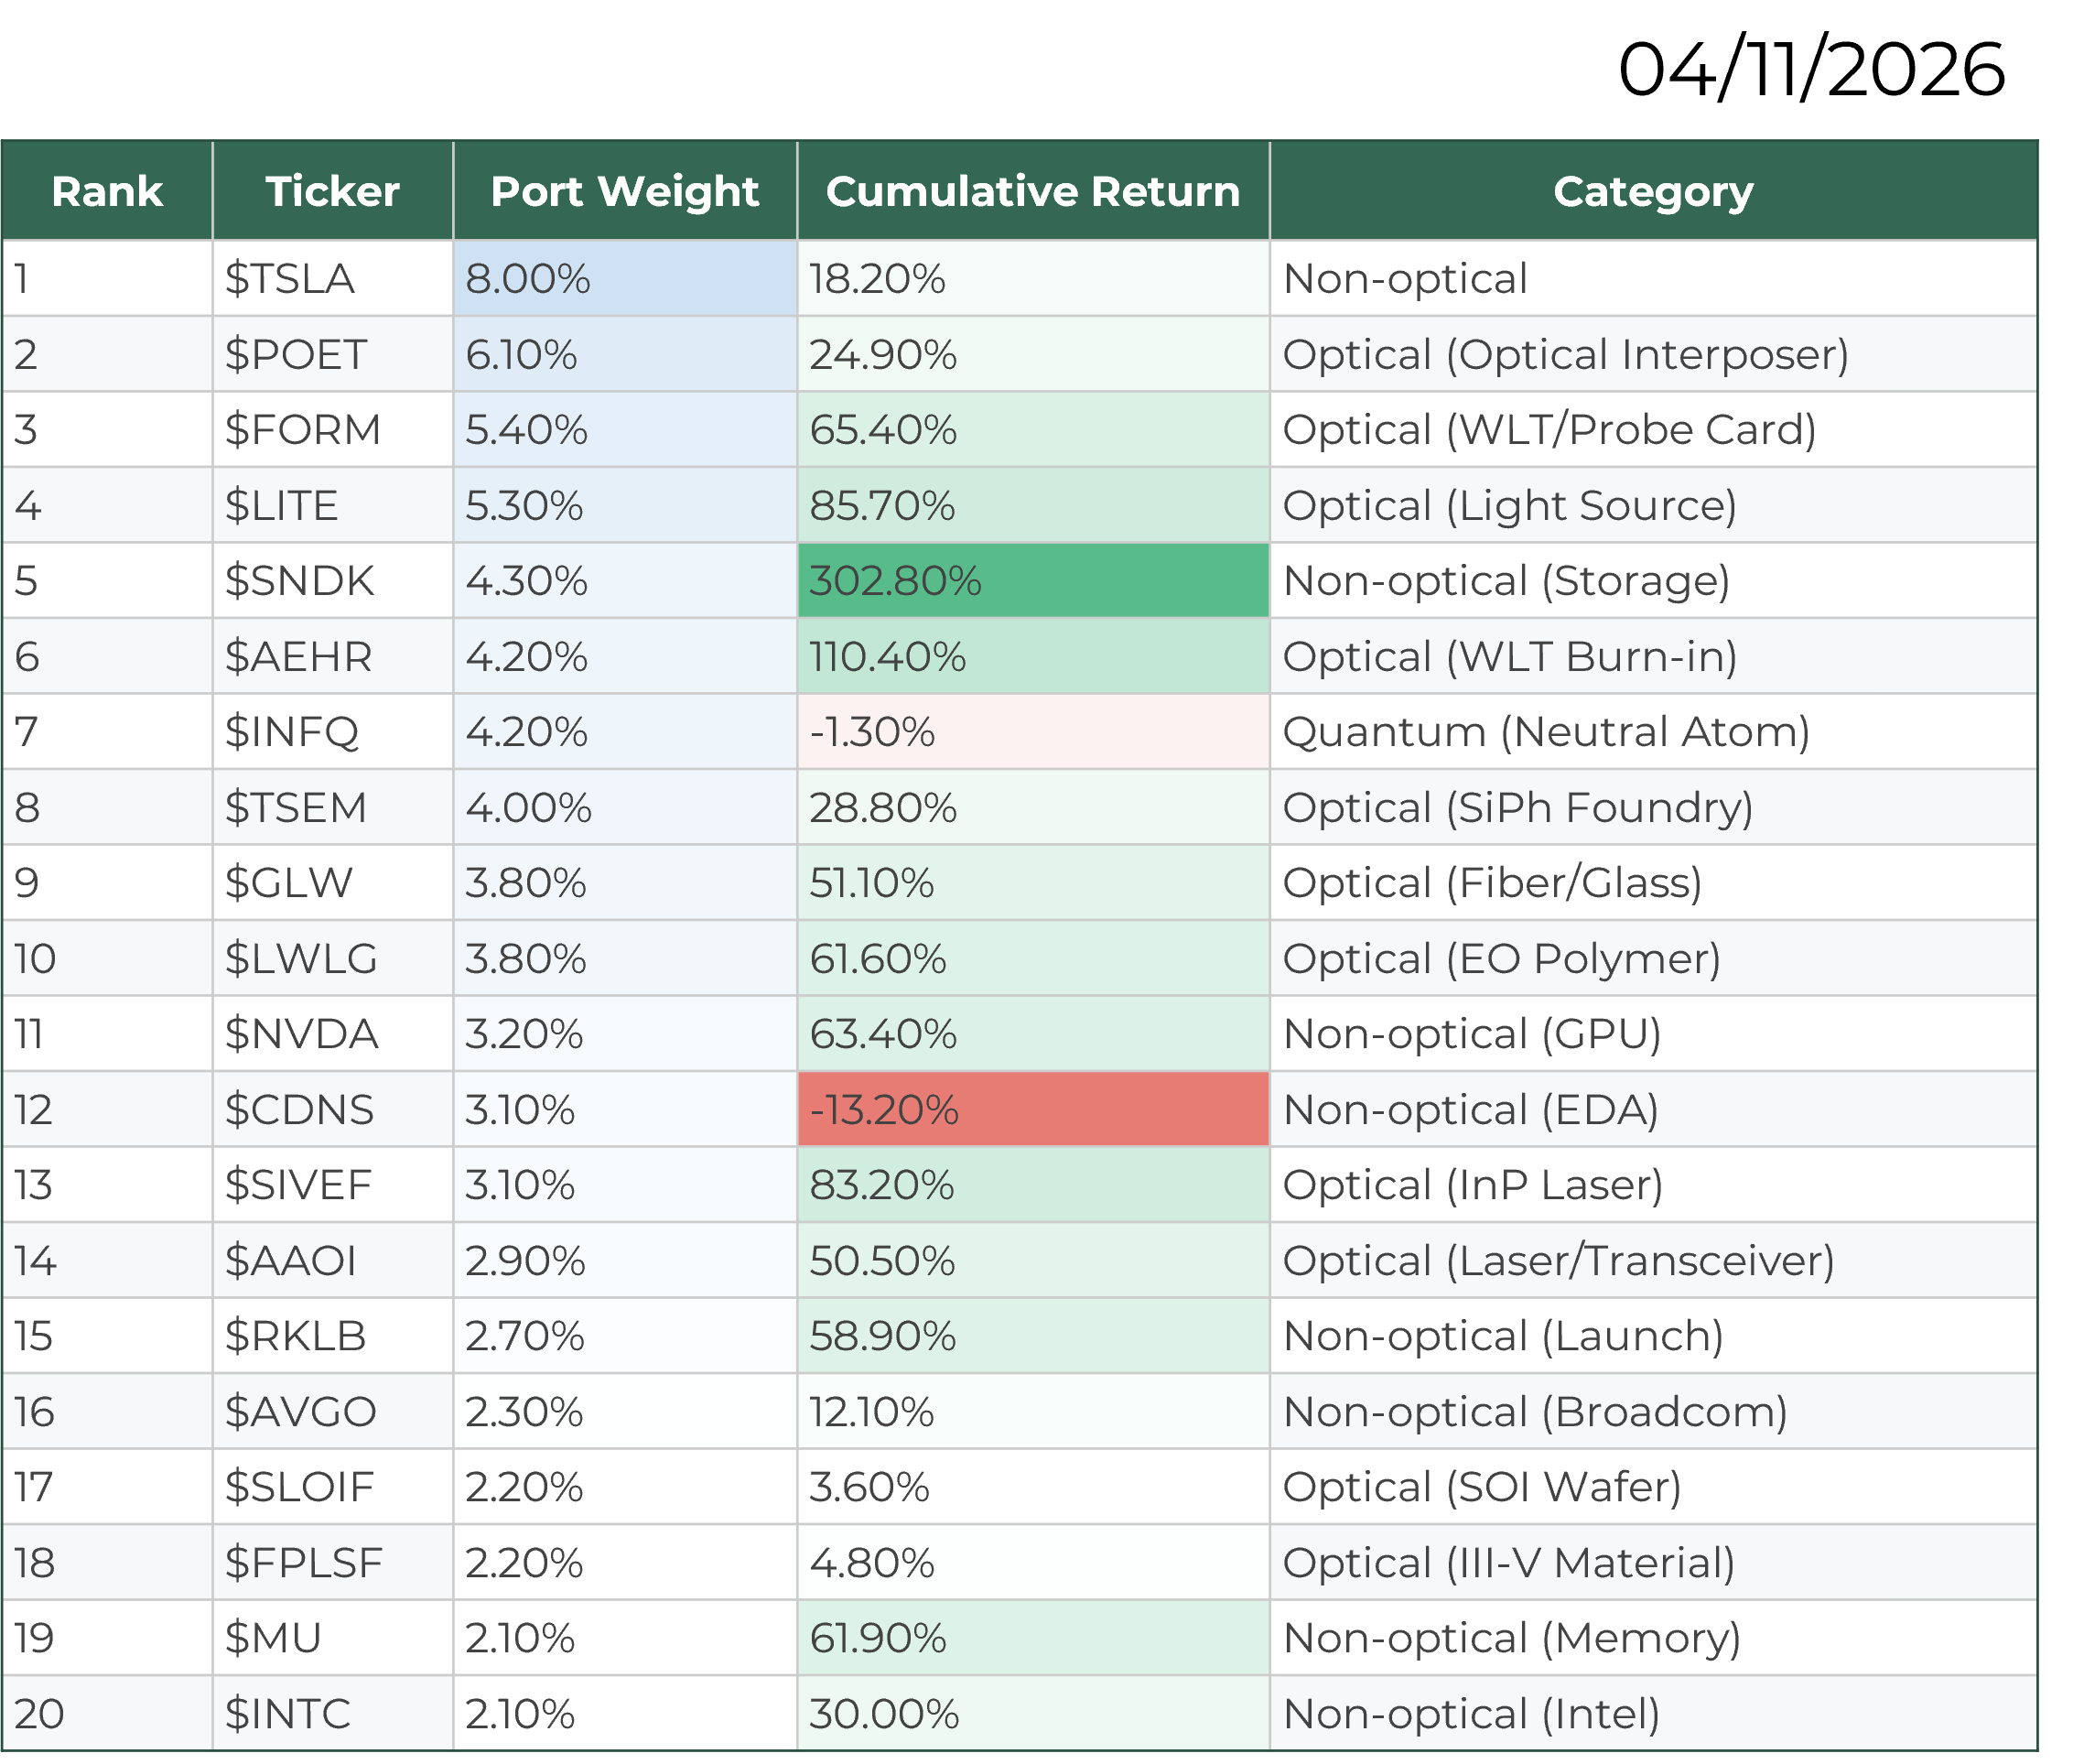
Highest returns: $SNDK (+302.8%), $WDC (+183.5%), $AEHR (+110.4%), $LITE (+85.7%), $SIVEF (+83.2%).
Worst performers: $IONQ (-42.2%), $ALMU (-38.6%), $QCOM (-33.5%).
Here’s the thing. High returns don’t equal high conviction. $SNDK is up +302% but only 4.3% of the portfolio. $POET is up +24.9% but carries a 6.1% weight. Allocation reflects conviction, not past performance.
Key takeaway: 58% of the portfolio sits in optical/SiPh names, and the 1-year combined return is +122%. The more optically concentrated the account, the higher the return.
That’s the “what.” Now for the “why.” Why is this portfolio so heavily concentrated in photonics, and what’s the reasoning behind each position?
That’s exactly what the rest of this article covers. But before we get there, let me walk through how the three accounts are structured.
3. Account Breakdown
Each account has a different character.
Account 1: SiPh Value Chain Focus | 1Y: +195.92%
This is the largest account and the most concentrated in optical names. It returned +195.92% over the past year, the highest of the three.
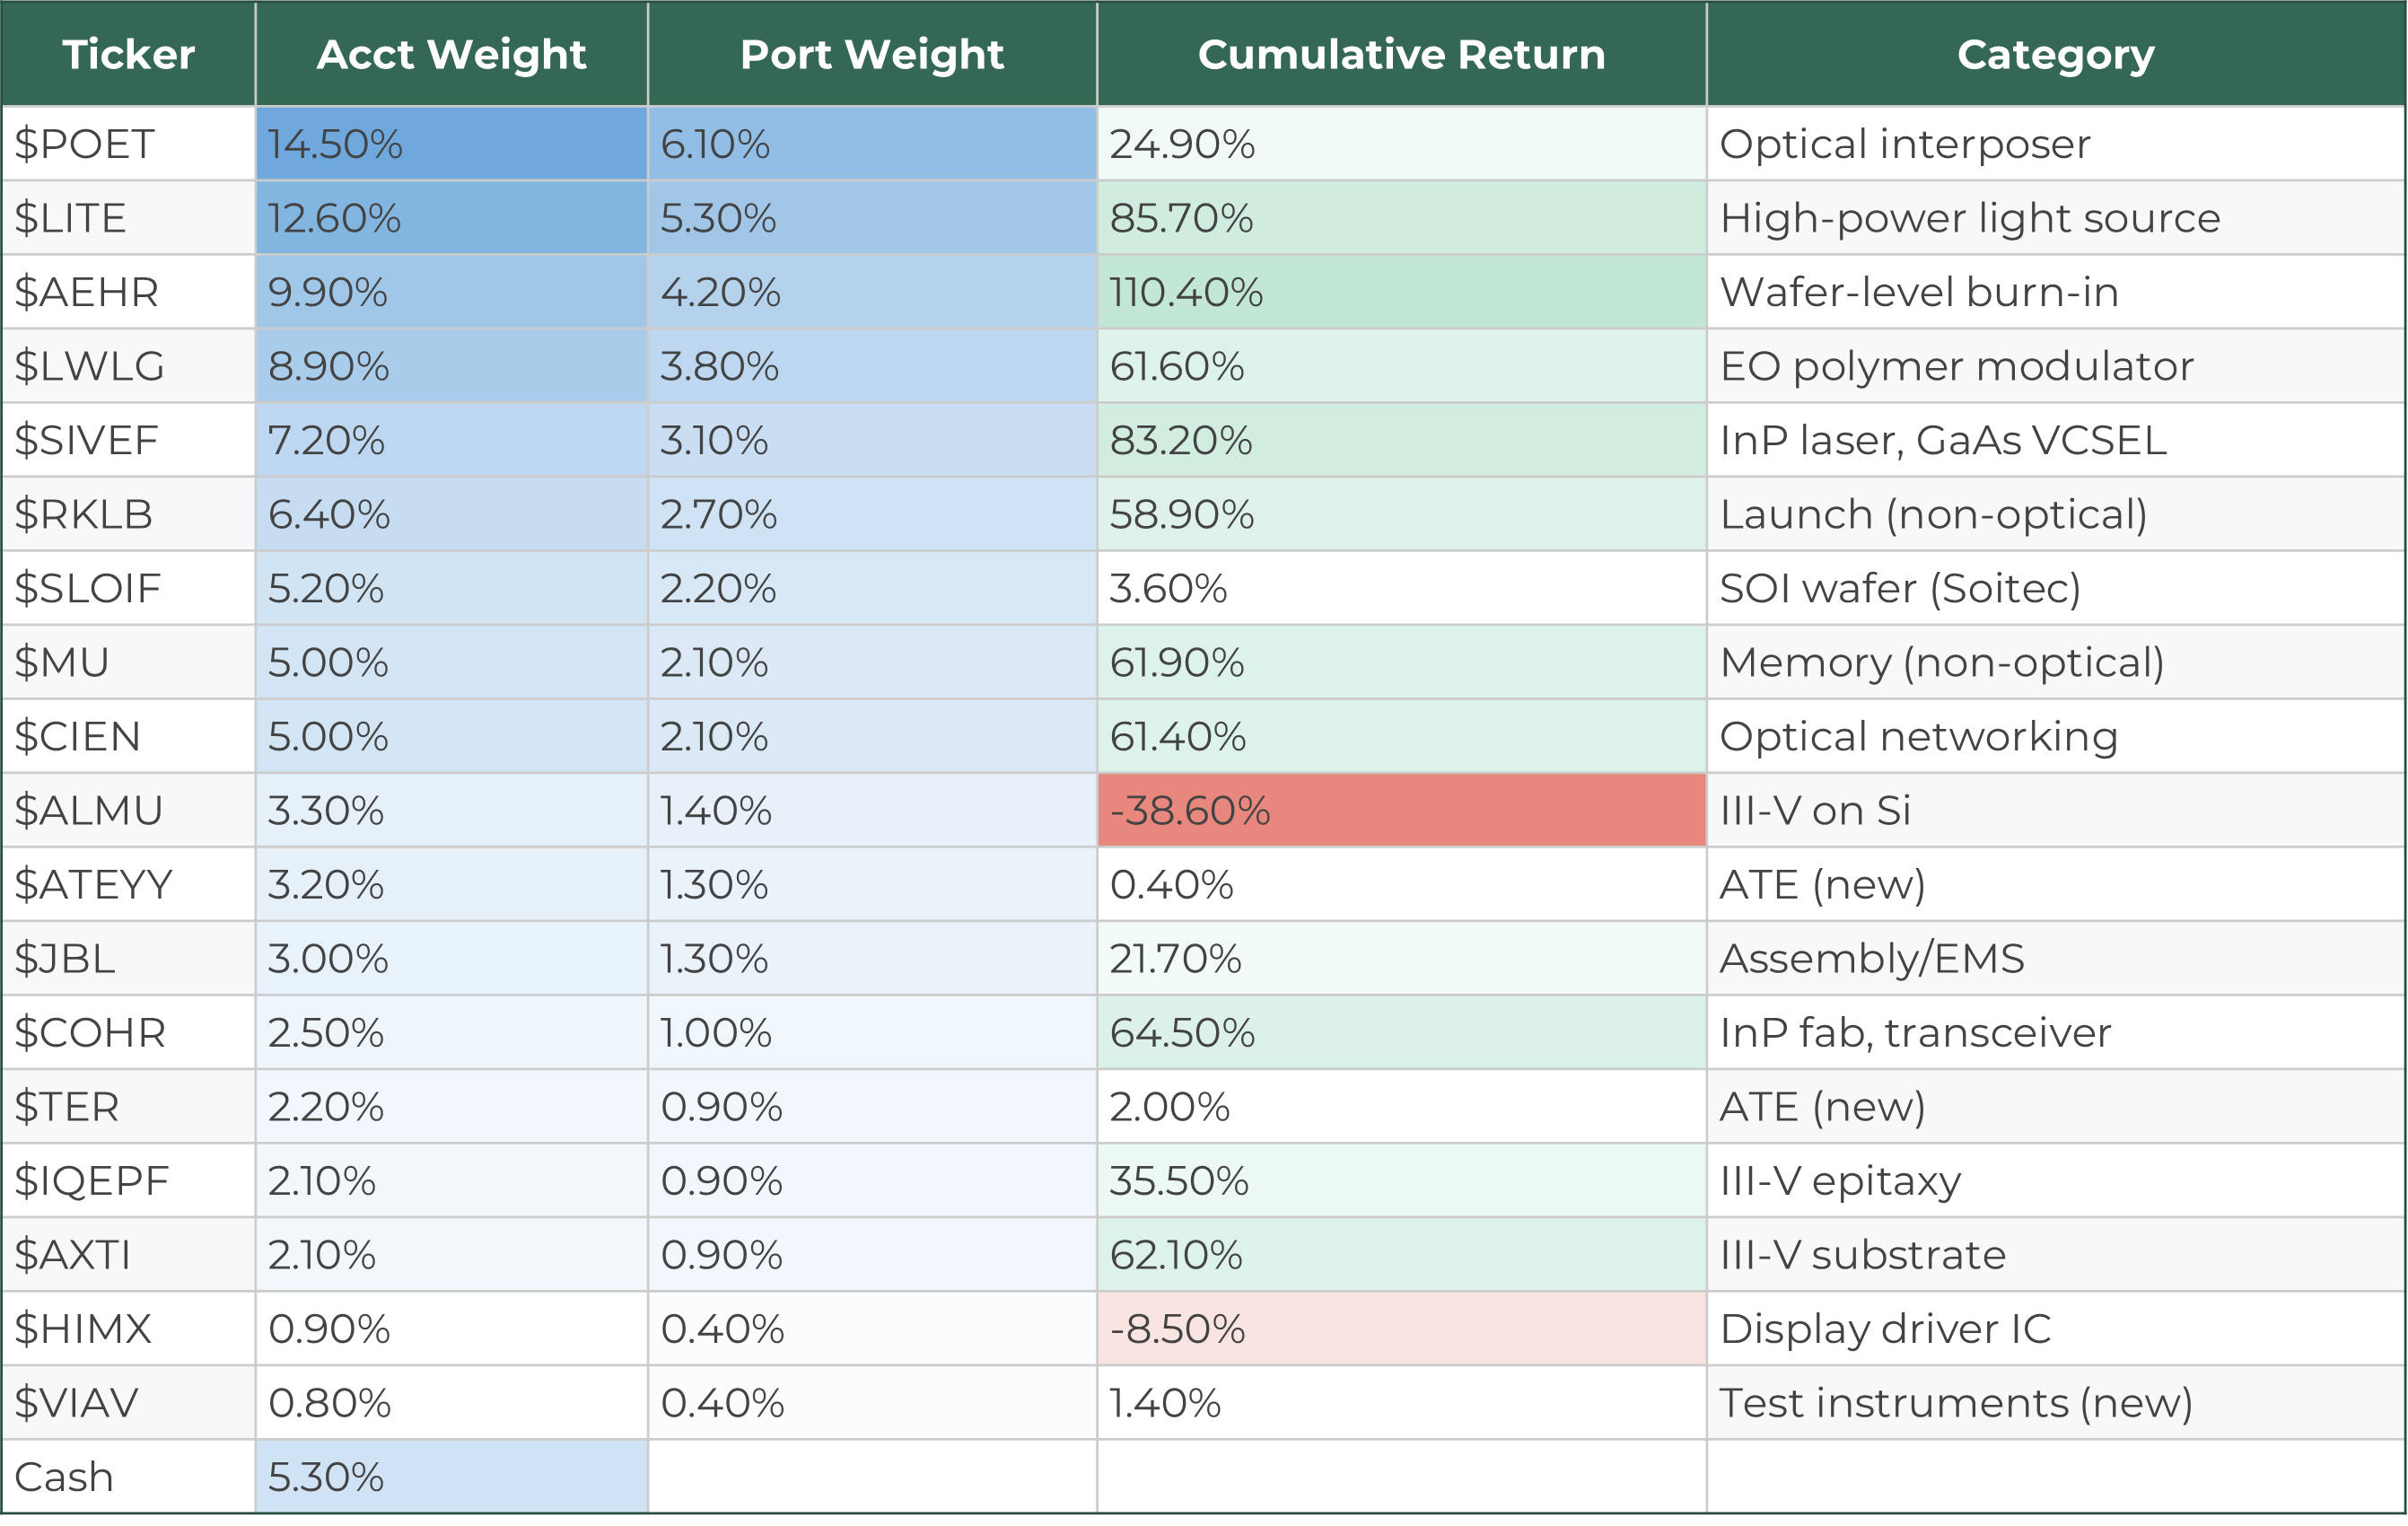
The top five positions in this account are all SiPh value chain names. $POET (optical interposer) and $LITE (light source) form the two main pillars, with $AEHR (WLT burn-in), $LWLG (EO polymer), and $SIVEF (InP laser) backing them up.
Account 2: Large-Caps + Foundries | 1Y: +143.29%
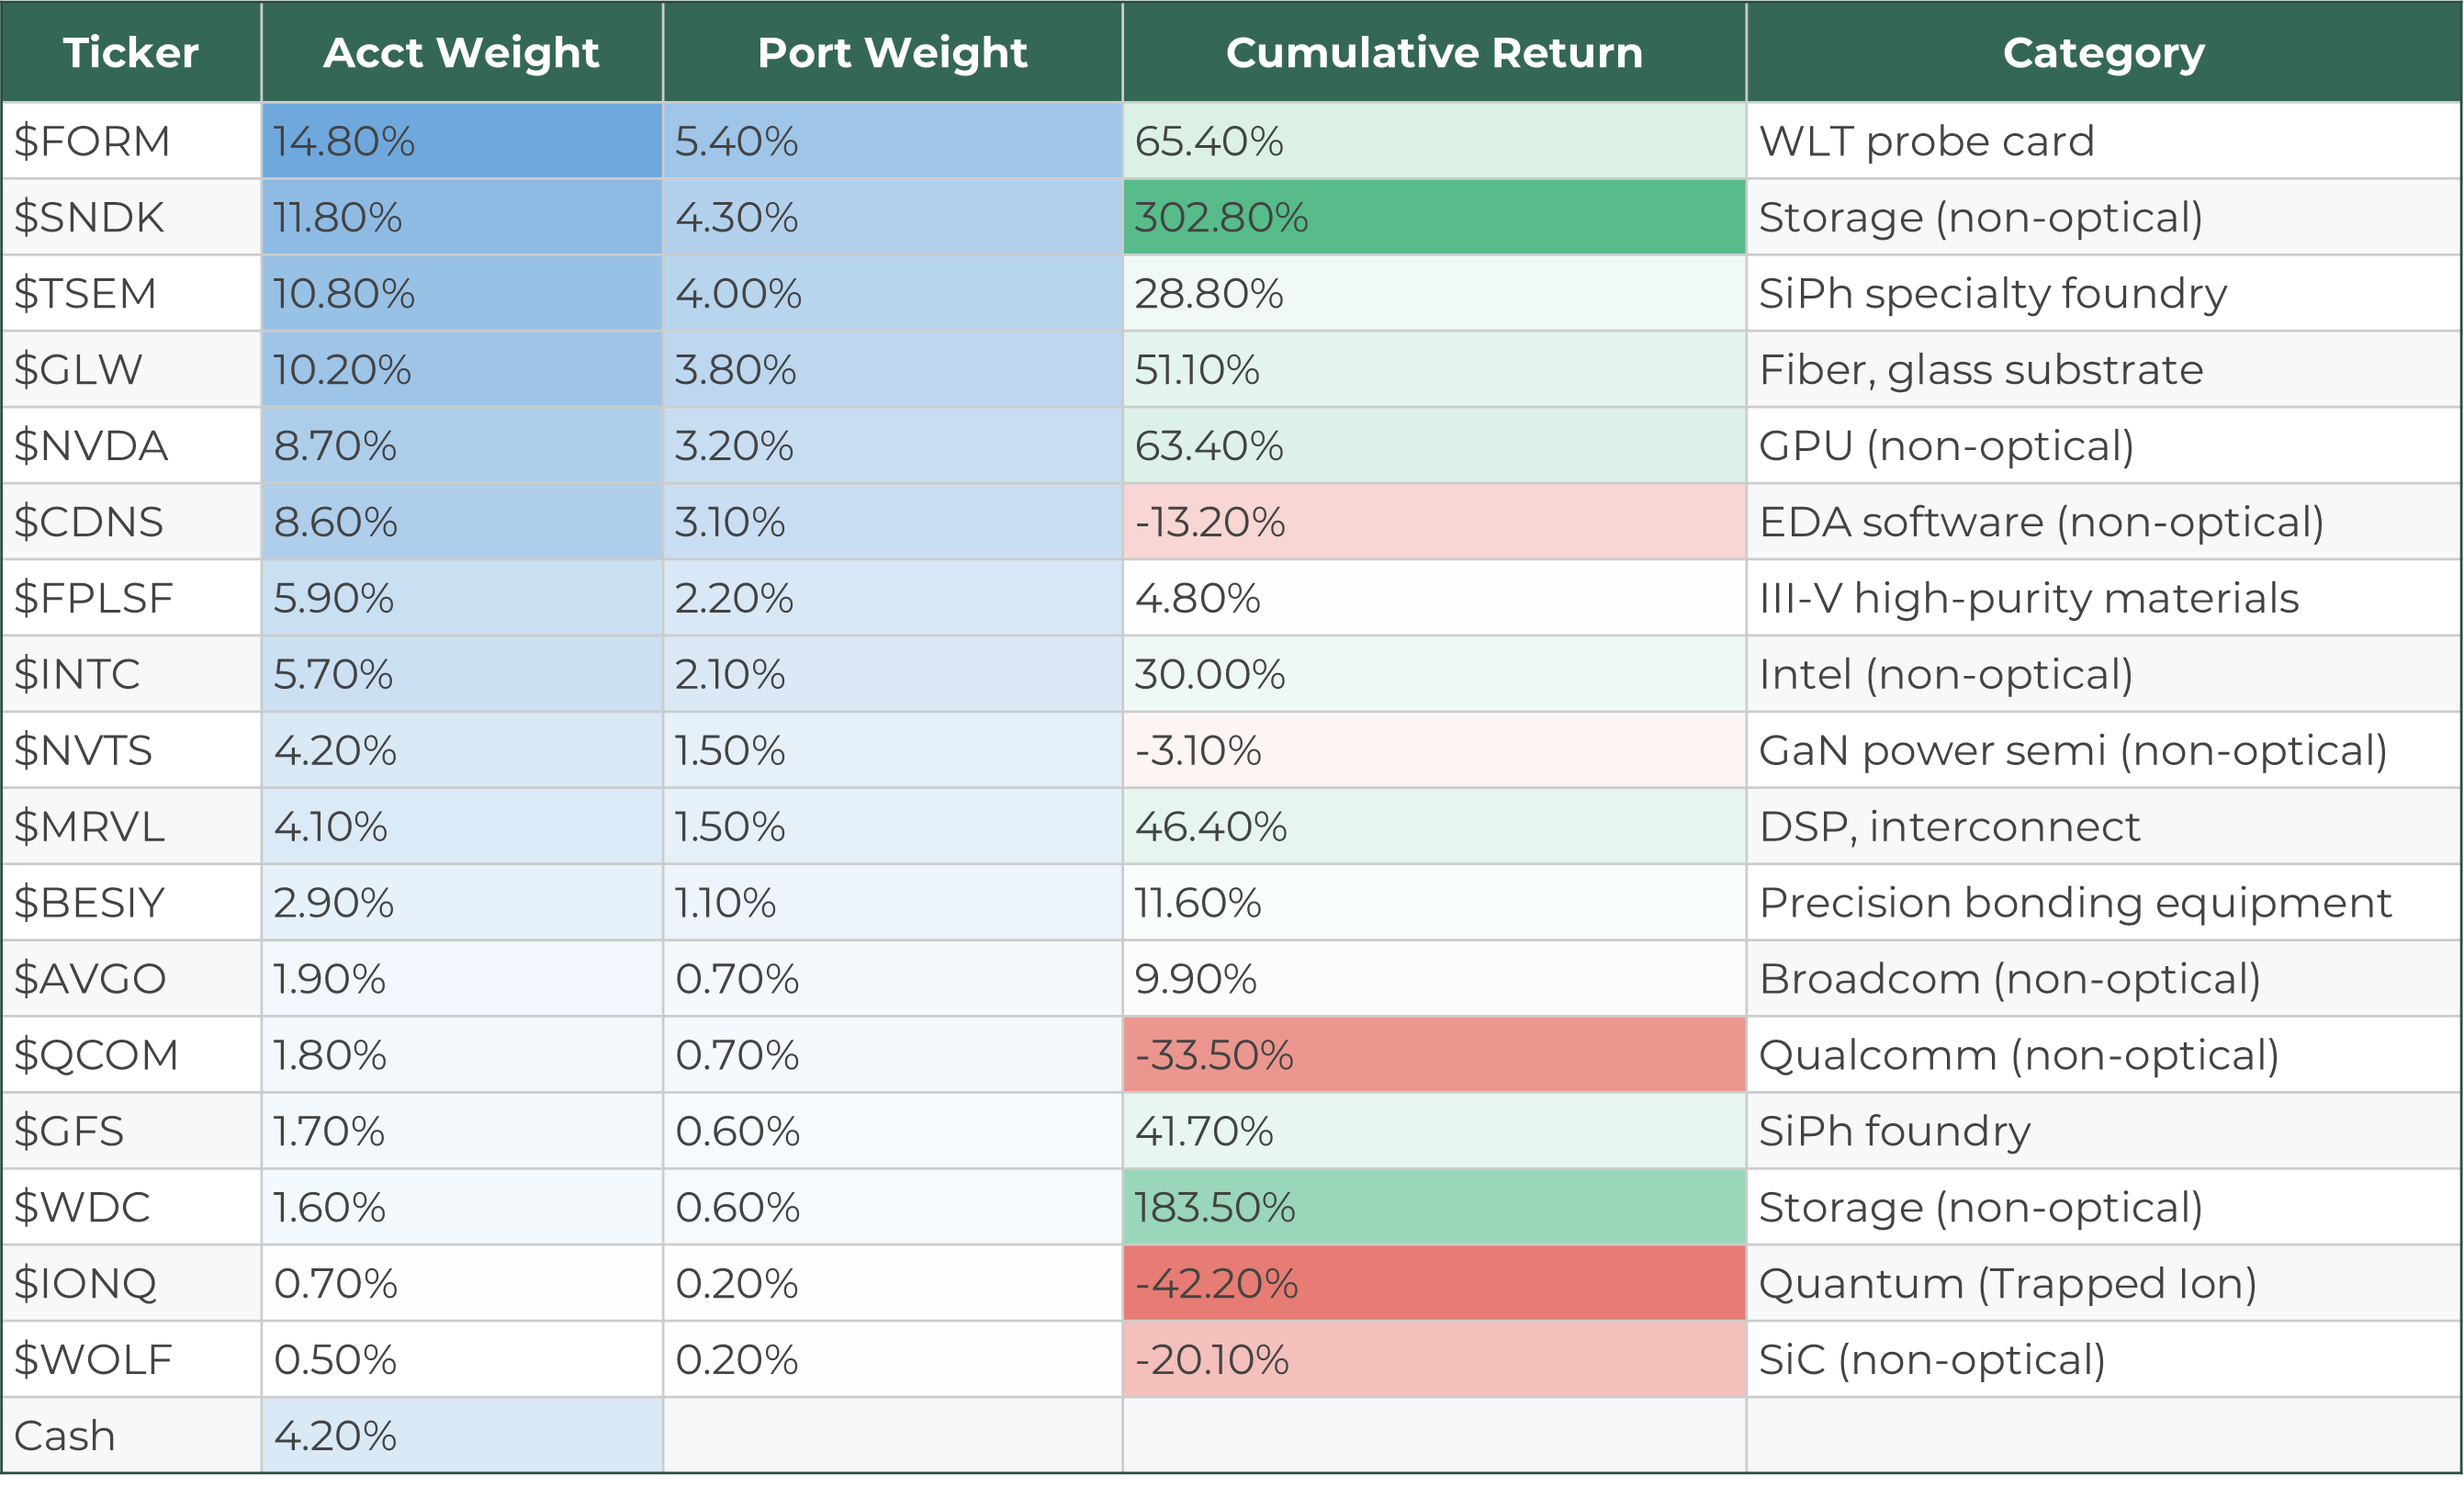
$FORM is the largest position in this account. It has exposure on both sides: probe cards for HBM testing and optical probes for SiPh wafer-level test, where it holds a dominant share. $TSEM (Tower Semiconductor) and $GLW (Corning) each carry 10%+ weights, covering SiPh foundry and fiber/glass substrate respectively.
Account 3: Non-Optical + Small Positions | 1Y: +51.18%
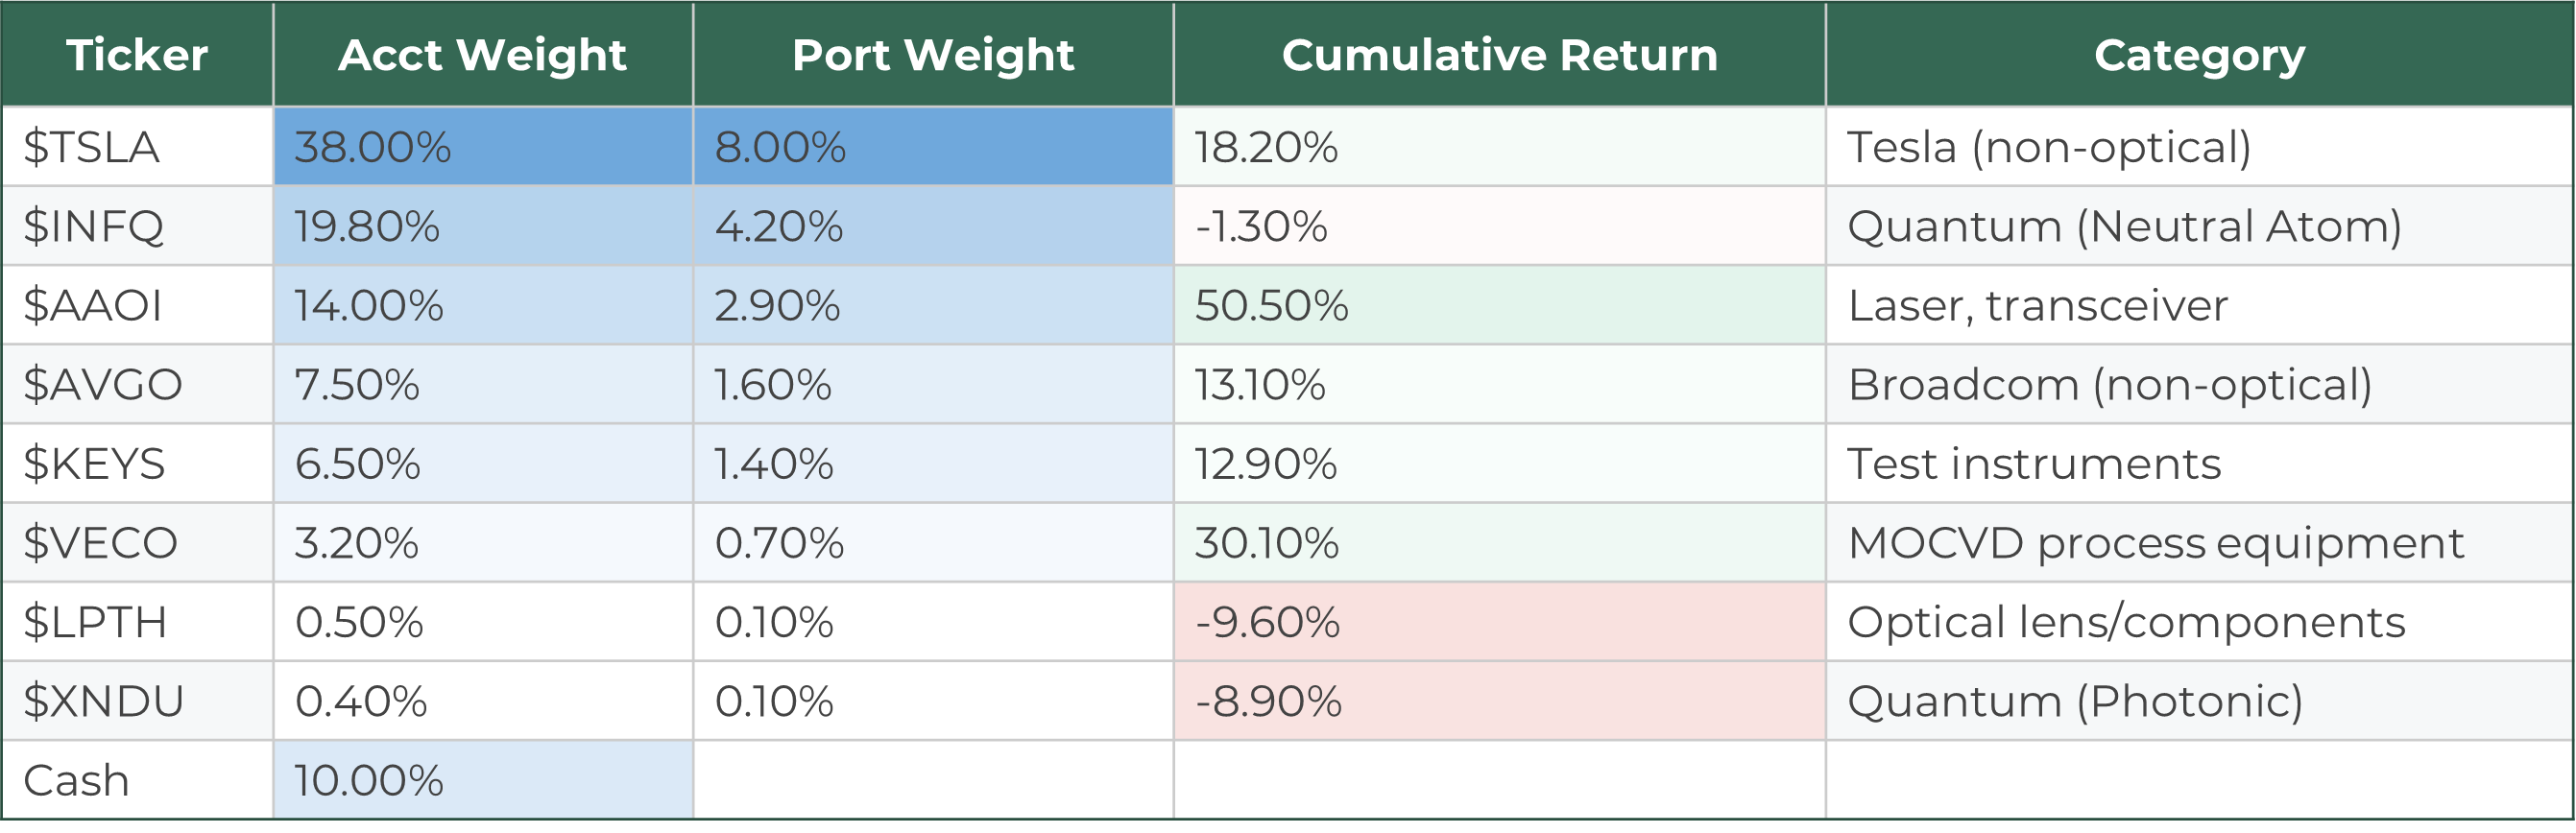
This account is dominated by $TSLA and $INFQ (quantum sensing/SiPh). On the optical side, $AAOI (Applied Optoelectronics) at 14% is the meaningful position here.
Key takeaway: The three accounts have distinct personalities, but optical names are distributed across all of them. Account 1, the largest, carries the heaviest SiPh concentration and the highest return.
So that’s the full breakdown by numbers. Every ticker, every weight, every return.
But the numbers alone miss something. Why did I put 6.1% into $POET out of 43 names? Why did I end up buying $LWLG after being deeply skeptical of organic polymers? Why am I still holding $ALMU at -38.6%? None of that shows up in a table.
And here’s what might be the most interesting part. I have a strict personal rule: I don’t invest in test equipment I haven’t physically operated with my own hands. That’s why I only held $FORM, $KEYS, $AEHR, and $BESIY for the longest time. Recently, I broke that rule for three names. Why I broke it, and whether the call was right, is below.
Finally, when you map all these tickers onto a SiPh value chain, they span five layers from substrates to networking. I’ll be honest about which layer I have the strongest conviction in, and which one makes me the most uneasy.
The interesting part isn’t the returns. The interesting part is why these specific companies ended up in this portfolio. From here, I go layer by layer through the silicon photonics value chain and explain why each position exists.
