
[$LWLG] The Day a $29K Revenue Company Raised Its TAM to $47B, and the Stock Dropped
$LWLG | Q1 2026 Earnings Analysis

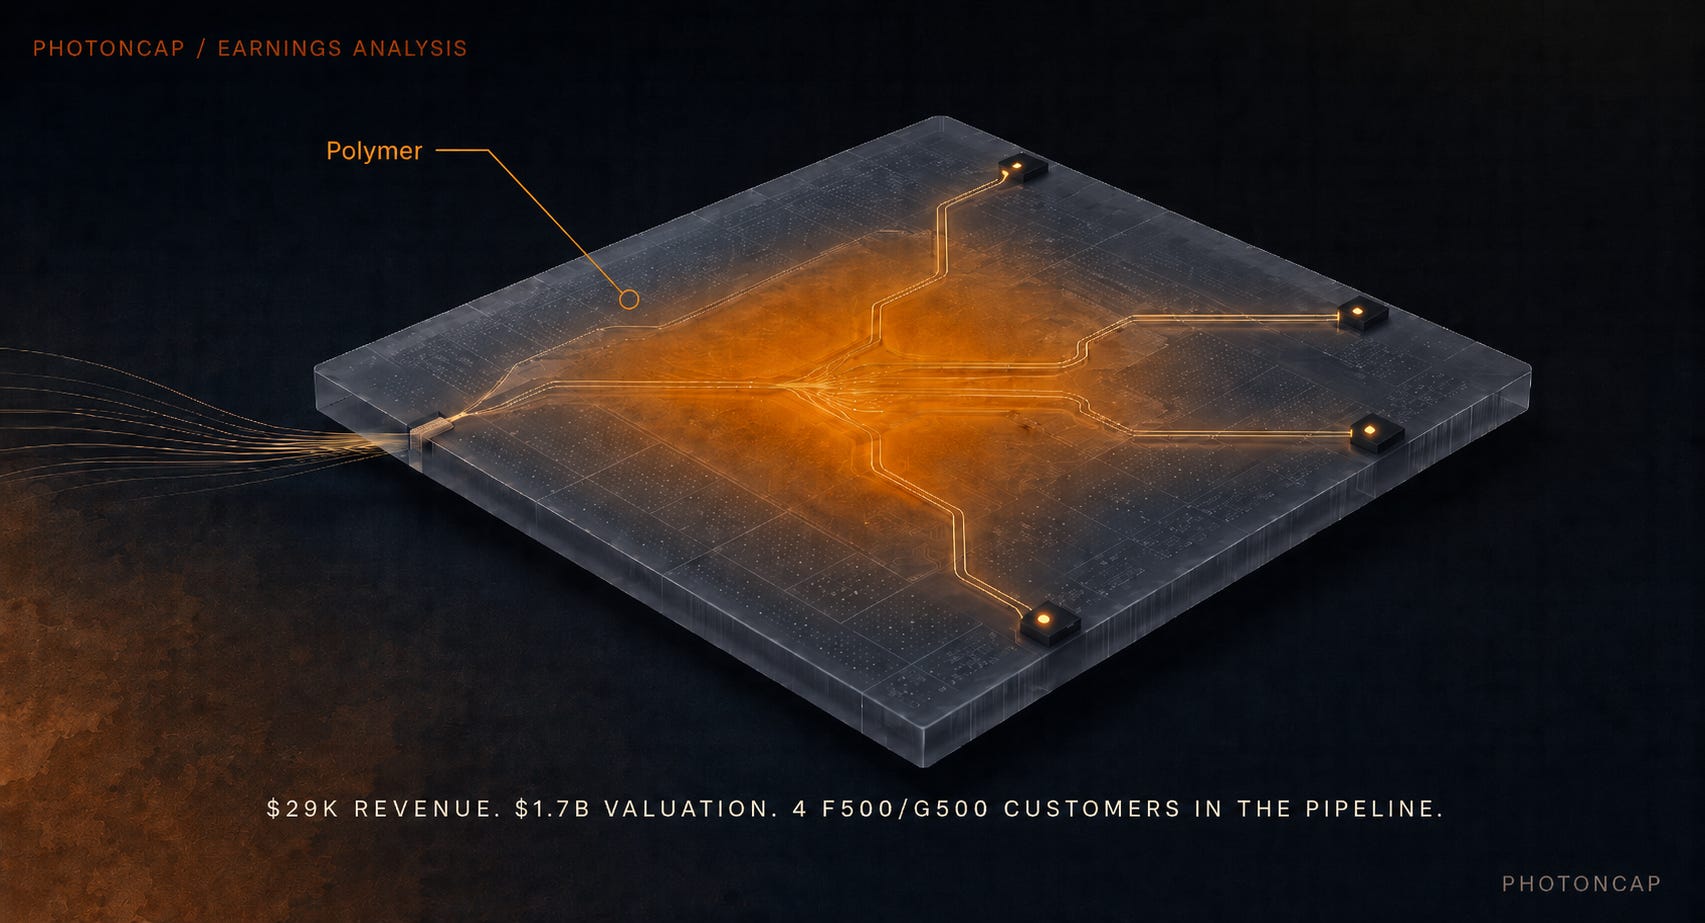
Lightwave Logic ($LWLG) raised its AI and data center optical transceiver TAM forecast from $17B to $47B and its SAM from $1B~$2.5B to $2B~$4B on the Q1 2026 earnings call. Four Fortune 500/Global 500 customers are now at Stage 3 (prototyping), with one to two additional Tier 1 customers expected by year end. Cash stands at $100M (as of 5/11). The stock hit a 52-week high of $18.71 intraday on earnings day, then fell to the $11 range within three trading days. This article breaks down Q1 results and earnings call commentary, analyzes the real implications of the TAM expansion, the shift in EO polymer competitive dynamics following the Marvell-Polariton acquisition, and the structural reasons behind the stock’s decline.
$LWLG: From $0.93 to $18.71 in 52 Weeks
The 52-week price range for $LWLG: low $0.93, high $18.71 [1]. Roughly a 20x spread.
That might look like pure volatility, but add a time axis and the picture changes. Through H2 2025, $LWLG traded between $1 and $3. The market valued this pre-scale commercial materials company, with quarterly revenue still measured in tens of thousands of dollars, at somewhere in the $200M to $400M range. Then 2026 happened. In January, the company hired Dr. Aref Chowdhury as CTO (formerly optical CTO at Nokia). In February, a fourth Fortune 500 company entered Stage 3. In March, PDK integrations with Tower Semiconductor and GlobalFoundries were announced back to back. By late April, the stock was trading in the $12 to $14 range.
On earnings day, May 13, the stock hit $18.71 intraday [2]. CEO Yves LeMaitre raised the TAM by roughly 2.8x and announced an expanding Fortune 500/Global 500 customer pipeline. The next day, it dropped 15 to 20% [2]. A resale registration for 402,500 shares by existing holders was filed [3], and the absence of a concrete contract announcement on the call gave traders the excuse to take profits.
As of May 19, the stock was around $11.1, putting the market cap at approximately $1.7B (based on 154M shares outstanding) [1][4].
This volatility tells the story of where $LWLG sits right now. The market is betting on the TAM expansion and SiPh ecosystem integration, but it is simultaneously wrestling with the reality of a “$29K revenue company at a $1.7B valuation.” Six months ago, the market cap was $300M. The fact that it rerated to $1.7B on expectations alone, and that those expectations could get shaved by nearly 40% in three trading days, says everything about the current tension.
Key takeaway: $LWLG’s 52-week range spans $0.93 to $18.71. The market cap rerated by more than 5x in six months, but dropped nearly 40% in three trading days after the earnings-day high. The tug-of-war between expectations and valuation gap remains live.
The Material on Top of SiPh: Why EO Polymer Now
The technical backdrop for this article connects directly to three previous PhotonCap pieces.
First, our analysis of the LWLG and Tower Semiconductor PH18 PDK integration, where we laid out Perkinamine’s technical moat (sub-1V drive voltage, BEOL compatibility, rare-earth-free) and the Design Win Cycle Stage 3 progress. Second, a polymer photonics deep dive comparing the materials technology across LWLG, NLM Photonics, and VisEra. Third, our Marvell-Polariton acquisition analysis, where we noted that Marvell’s official announcement emphasized plasmonics-based modulation technology but did not specify the IP scope for organic EO chromophores.
Layering the Q1 earnings call updates onto that context sharpens the picture.
TAM Expansion: The Structure Behind SiPh Going to 70%
LeMaitre projected that SiPh will grow from approximately 23% of the optical transceiver market in 2021 to over 70% by 2030 [5]. This framing matters for LWLG because Perkinamine does not compete with SiPh. It sits on top of SiPh. As SiPh foundries gain market share, the addressable market for Perkinamine integrated into those foundry PDKs expands in lockstep.
Understanding that structure changes how the TAM numbers should be read. The 2028 AI and data center optical transceiver TAM that LeMaitre raised to $47B (up from $17B, roughly 2.8x) is not “LWLG’s market.” It is the total transceiver market that LWLG could supply materials into [5]. The expansion is driven by upward revisions to 1.6T and 3.2T transceiver deployment forecasts, growing CPO demand above 200Gbps per lane, and rapid growth in the scale-across market (DCI, inter-campus connections) [5].
The SAM (Serviceable Addressable Market) that LWLG claims as actually penetrable rose from $1B~$2.5B to $2B~$4B [5]. Still a large number, but it represents roughly 4 to 9% of the TAM.
Foundry Ecosystem Expansion
LWLG now has PDK integrations completed or in progress at four foundries: Tower Semiconductor (PH18), GlobalFoundries (via GDSFactory), SilTerra (via Luceda Photonics), and AMF [5][6][7]. A year ago, the company depended on AMF alone. On the call, LeMaitre acknowledged that “foundry capacity constraints remain an industry-wide bottleneck” but projected that “new investments and new entrants will balance supply and demand within 12 months” [5].
Reliability Data: Telcordia 85/85 Passed
A significant technical update: device-level Telcordia stress testing was passed. Testing at 85°C and 85% relative humidity validated thermal stability and environmental robustness [5]. The oldest technical concern around EO polymers has been the long-term reliability of organic materials, and this result is a direct data point against that concern. LeMaitre commented that “recent reliability results at the device level represent another important step towards commercial readiness” [5].
Earnings Call Headline Numbers
Revenue $29K (YoY +27%), net loss $6.3M (EPS -$0.04), R&D $3.5M, G&A $3.3M (YoY +77%), cash $75M (Q1 end) to $100M (as of 5/11) [4][5]. Four Fortune 500/Global 500 customers at Stage 3, with one to two Tier 1 additions expected by year end [5]. Material supply and licensing agreement in negotiation with a lead customer, targeting 2027 high-volume production [5].
Key takeaway: SiPh market share expansion (23% to 70%+) is a direct TAM tailwind for LWLG. The foundry footprint has grown from one to four. Device-level Telcordia 85/85 testing passed. Of the $47B TAM, LWLG’s SAM is $2B to $4B.
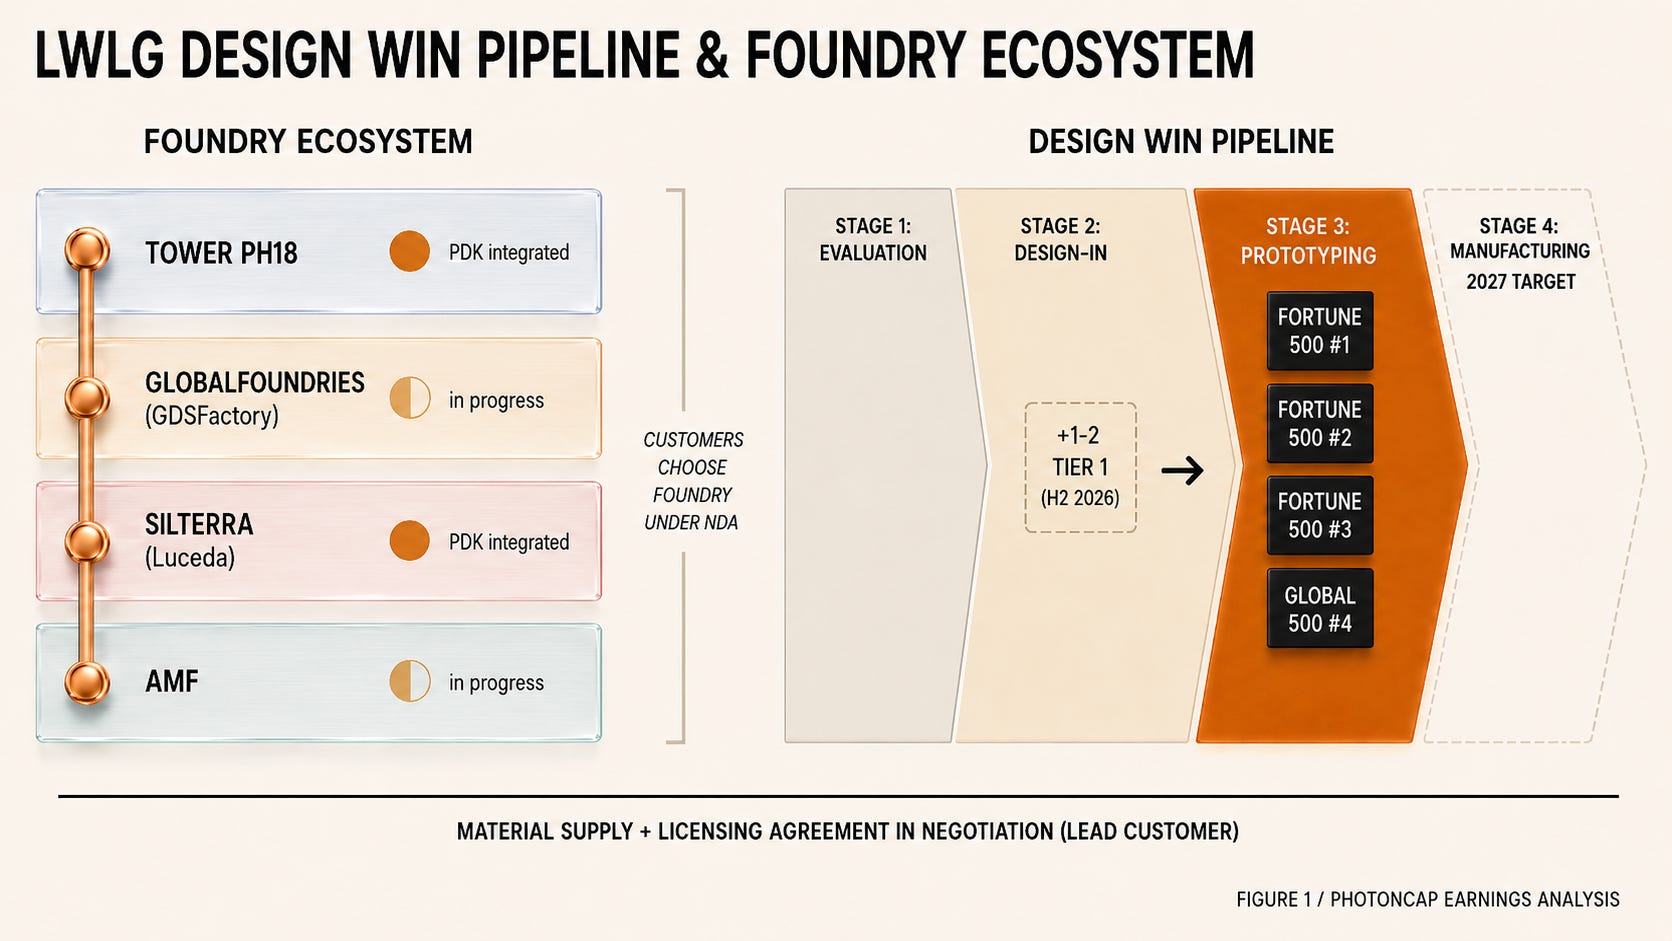
[Figure 1: LWLG Design Win Pipeline & Foundry Ecosystem Map]
That covers the “what happened” from public sources.
The real questions sit beneath the surface.
A $47B TAM is nice, but what assumptions underpin the $2B to $4B SAM? The key variables management used to derive it, including SiPh modulator adoption rates, ASPs, and integration levels, were not disclosed. Whether those assumptions are realistic or anchored to a bull case changes the credibility of the SAM entirely.
What specifically needs to happen for the four Stage 3 customers to cross into Stage 4 (manufacturing)? What is the structure of the “material supply and licensing agreement” LeMaitre referenced, and what revenue scale does it imply for LWLG? Will the foundry bottleneck actually clear within 12 months, or does surging SiPh demand keep pushing emerging processes like polymer further down the priority queue?
Is the near-doubling of G&A in one year a sign of “commercialization readiness” or expense creep in a company with no scaled commercial revenue? How exactly has the competitive landscape changed now that Marvell acquired Polariton? A year ago, LWLG was the only EO polymer player with SiPh foundry PDK integrations. With NLM Photonics now active at both GF and Tower, and Marvell internalizing SOH modulators, what does the new map look like? And was the 40% post-earnings drop just profit-taking, or did the market detect a structural crack?
Below, we break down the Q1 cost structure, the path from Stage 3 to Stage 4, the limits of the TAM/SAM assumptions, the updated Marvell-Polariton competitive landscape, the structural reasons for the price decline, the emerging dual revenue model from IP strategy and the Denver production line, and scenario-specific monitoring points.
