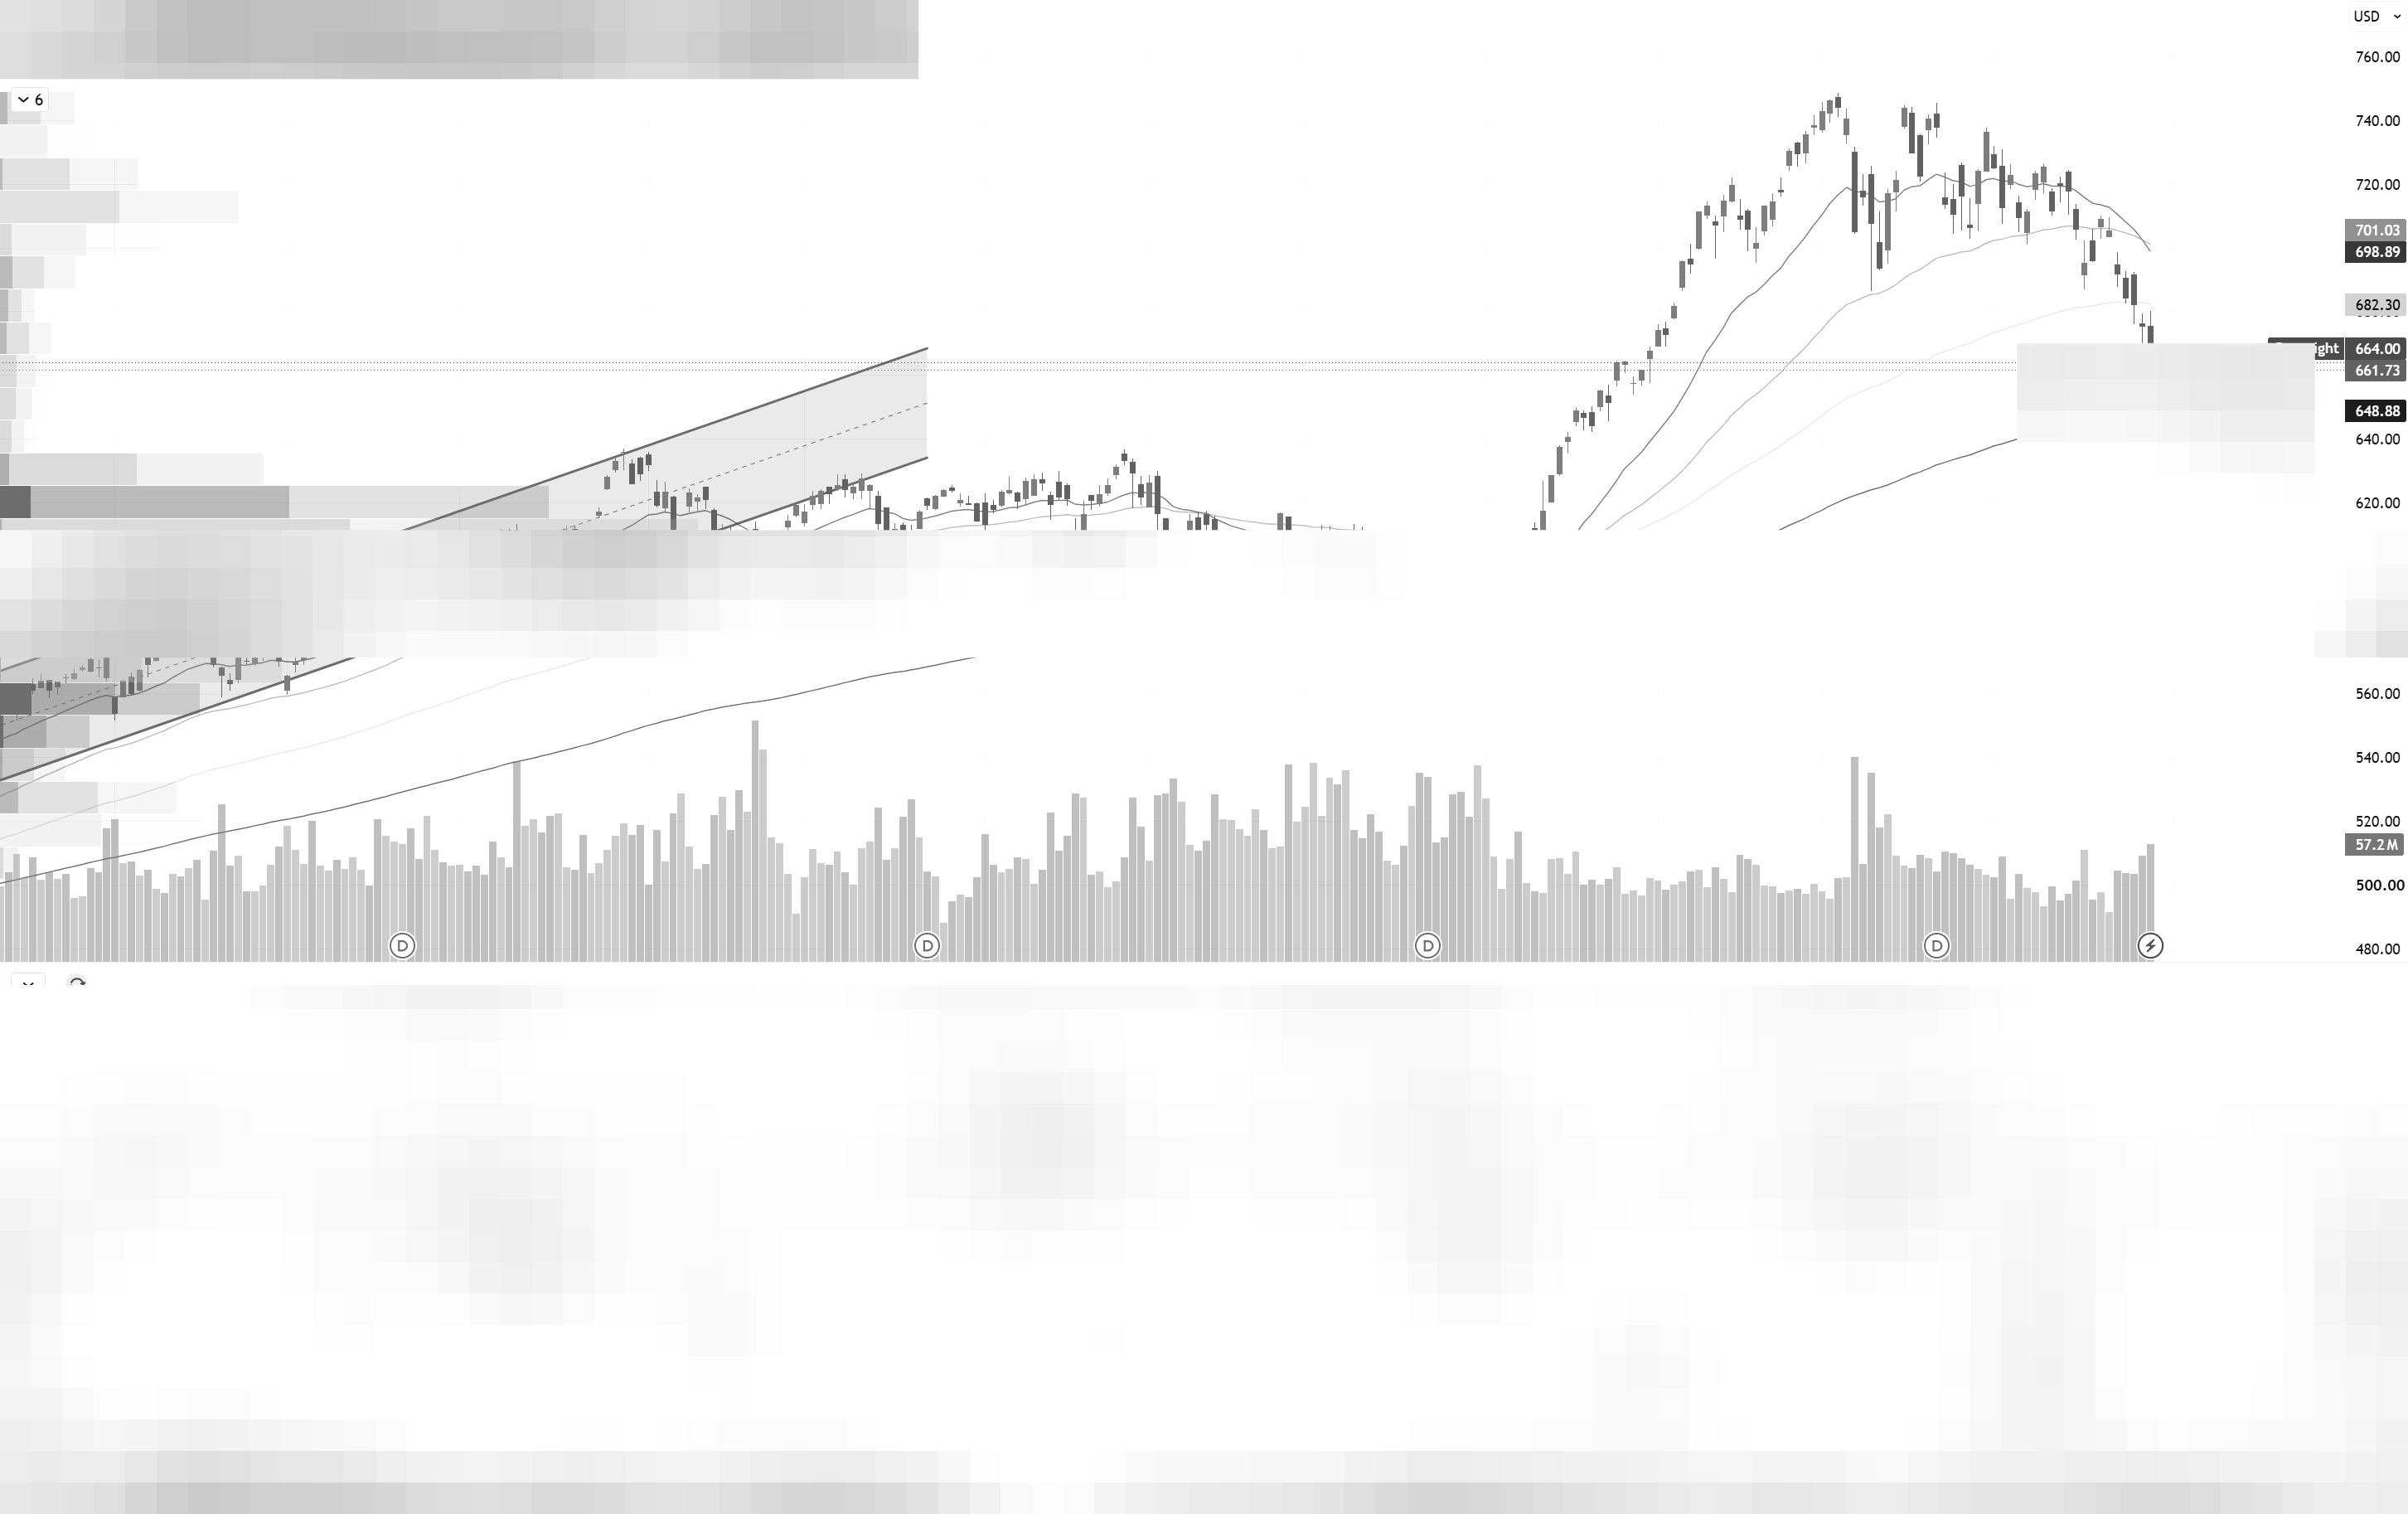
Interestingly, $QQQ fell more than 2% on Wednesday. The decline that started off the May highs has now brought the index right on top of its 200-day EMA. The line sits around 648, roughly 2% below the close.
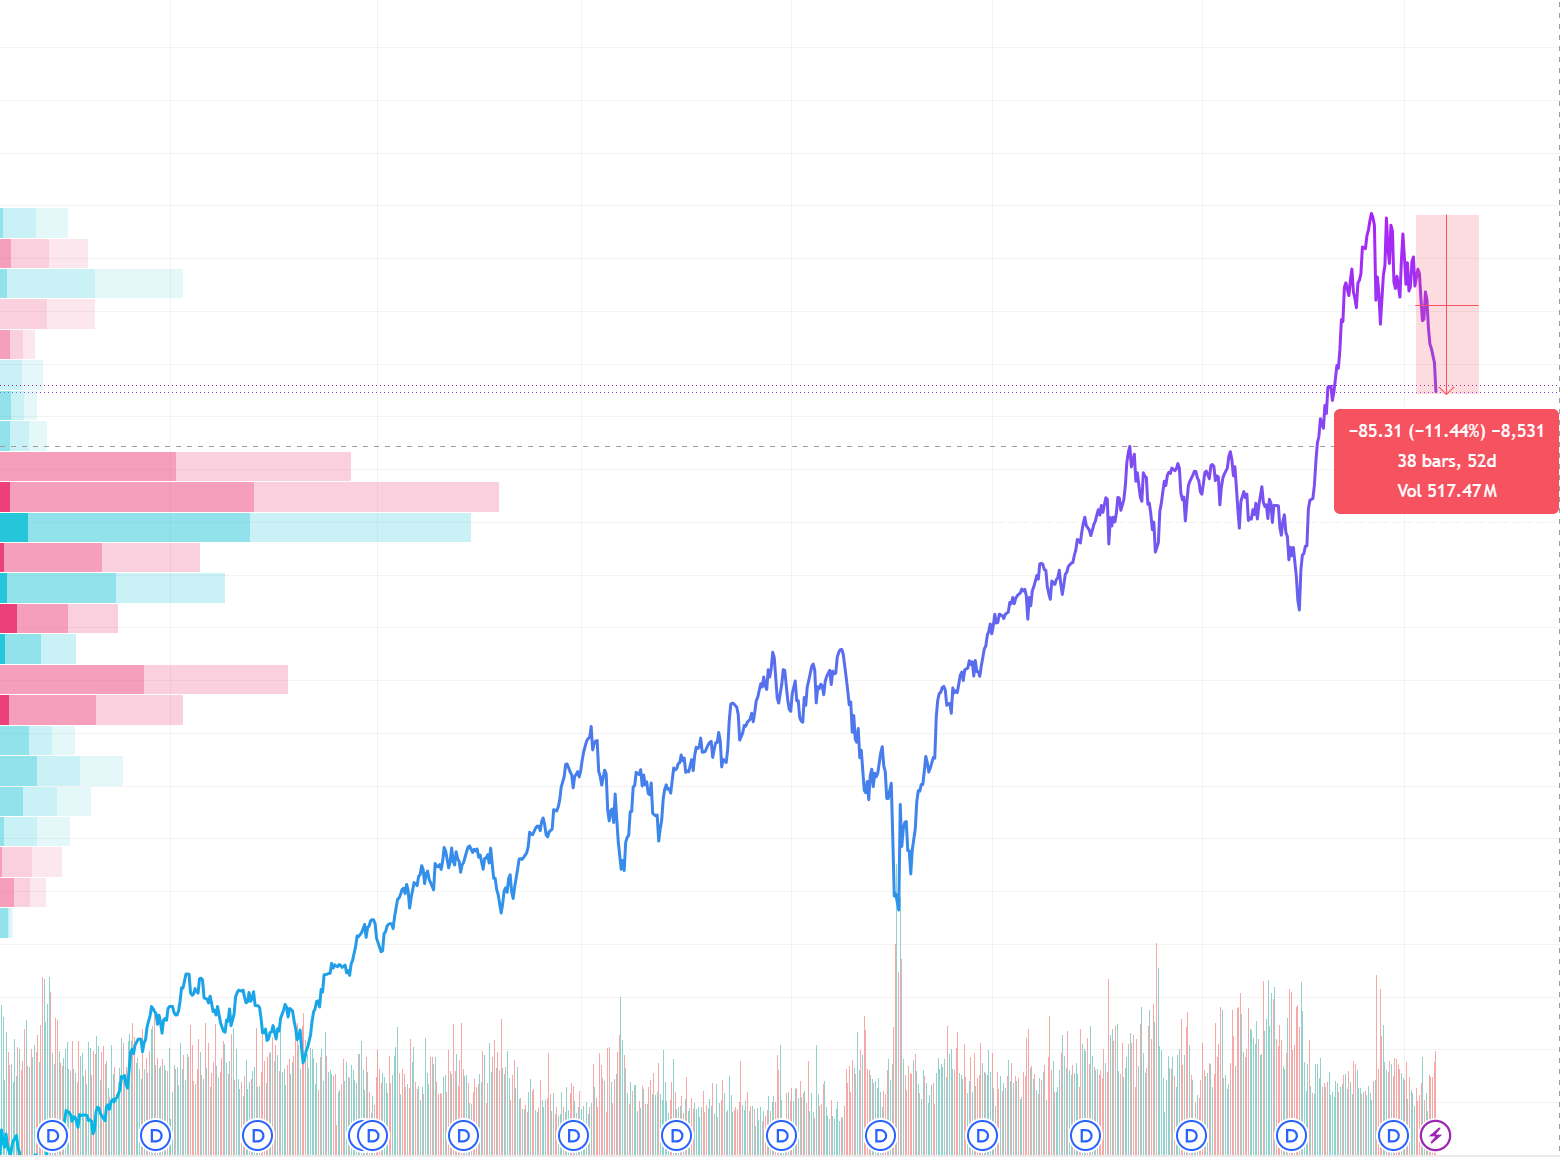
$QQQ is now down more than 11% from the high, and most of that damage came in the last two weeks.
The chart alone doesn’t explain this selloff. Start with what actually happened yesterday.
So, What Happened? (AI summary)
The Fed held rates at 3.50–3.75% at the July FOMC meeting, its sixth straight hold. The hold itself was expected. Going into the meeting, fed funds futures put the odds of a hold around 68%.
The tone was the problem. Three of the twelve FOMC members dissented, and they wanted a hike. Not a cut. A hike. In the press conference, Chair Warsh stuck to his policy of withholding forward guidance and took a hard line on inflation, and he made clear he has no interest in suppressing the recent rise in Treasury yields, saying the Fed is deliberately stepping back to watch the market’s reaction. The Nasdaq 100 and S&P 500 gave back all of their gains during his remarks.
This matters because the market is not waiting for cuts right now. After the meeting, futures priced the odds of a 25bp hike in September in the mid-50% range. Oil is the reason. Crude is up more than 20% in July on the conflict with Iran, and the expected pass-through to headline inflation is what the hawks inside the Fed are pointing to.
The bond market also added to the pressure. The 10-year rose to 4.67% and the 30-year jumped to 5.21%, its highest level in 19 years, while the 2-year actually fell. Long rates rising alone is a steepener, and it reads like the bond market questioning whether the Fed has inflation under control.
Against that backdrop, the Dow dropped 2.19% for its worst day since April 2025, and the Nasdaq fell 1.74%, ending the session more than 10% below its all-time high. Official correction territory, if you care about the label.
The AI and AI Infrastructure Side
The other axis of this selloff is a shift in how the market treats AI capex. As you already have seen, last week, Alphabet (Google) raised its 2026 capex forecast and the stock fell 7%, dragging Amazon, Meta, and Microsoft down with it. Alphabet guided to roughly $200 billion of capex over the next twelve months, and its quarterly free cash flow went negative for the first time in company history. The problem wasn’t that spending fell. The problem was that it kept growing.
Last night’s earnings showed both sides of that trade. Microsoft beat with $90 billion in revenue and held its calendar 2026 capex plan steady, and the stock popped 8% after hours. Spending unchanged, but “the envelope isn’t blowing out” was enough for a relief rally.
Meta beat on revenue at $60.8 billion but missed badly on EPS, raised the floor of its full-year capex guidance to $130 billion, and reported free cash flow of just $784 million. Yes, million. The stock fell 5% after hours.
There is still no sign that demand has cracked. Microsoft has disclosed a backlog of Azure orders it cannot fulfill because of power constraints and demand is outrunning supply. What the market is punishing is not demand. It’s the pace of spending, the disappearing free cash flow, and the fact that more of this buildout is being funded with debt. With the long bond at a 19-year high, that combination compresses multiples.
Where the Chart Sits
A brief word on why QQQ is the chart I’m watching, and not the S&P. The drawdown is simply bigger here. The Nasdaq is more than 10% off its high while the S&P’s decline is shallower, and that gap is the point: this selloff is concentrated in tech, and inside tech, in AI and AI infrastructure names. Those are QQQ’s largest weights. If this is a repricing of the AI trade, QQQ is where it shows up first and where it will resolve first.
On the QQQ daily:
The pattern of lower highs since May turned into a fast decline over the past several sessions. The 20-day and 50-day are gone, and the 100-day area has given way.
The 200-day EMA sits around 648–649 and is still rising. Price is about 2% above it.
600 (I mean a round number) is the level the index chopped around for months starting late last year. If the 200-day fails, that’s the next level.
RSI is at 32.4, near the oversold line at 30 but not through it.
Volume has been building on the down days.
I’ll get to the late-March comparison below. Short version: the shape is similar, the backdrop is not.
The calendar isn’t done either. Amazon reports after the close on Thursday, the last of the four hyperscalers.
That covers what can be verified in the market right now. Below, I lay out why I lean toward calling this a correction, how much weight the March analog can actually carry, and what would change my mind.