A Company With $88M in Annual Revenue Just Got a $6B Market Cap: What AXTI’s Q1 Changed, and What It Didn’t
$AXTI, $LITE, $COHR, $AAOI: InP Substrate AI Optical Cycle Follow-Up Analysis
AXT Inc. (AXTI), with FY2025 revenue of $88M and a net loss of $21M, has crossed $6B in post-offering pro-forma market cap. Trailing 12-month return exceeds 6,000%. FY2025 trailing P/S sits at roughly 70x. Even on a Q2 guidance annualized basis, run-rate P/S is around 46x. The Q1 2026 results released April 30 confirmed InP revenue of $13.6M (QoQ +70%), non-GAAP gross margin of 29.9% (up from negative 6.4% a year ago), and InP backlog exceeding $100M. Q2 guidance points to the company’s first profitable quarter in its history (non-GAAP EPS $0.06 to $0.08). This follow-up confirms Q1 as the first signal of a narrative-to-earnings conversion, while reverse-engineering the future that the current price already reflects.
Related tickers: $AXTI, $LITE, $COHR, $AAOI.
Contents
Intro: An $88M Revenue Company With a $6B Market Cap
Q1 Results: The Margin Inflection and $100M Backlog
Export Permits + China Domestic: The Structure Is Shifting
Demand Is Confirmed. But What About the Price?
Valuation Reverse-Engineering: The Weight of Three P/S Ratios
Insider Selling + Dilution + Competitor Expansion
Scenarios + Monitoring + Closing
References & Sources
1. Intro: An $88M Revenue Company With a $6B Market Cap
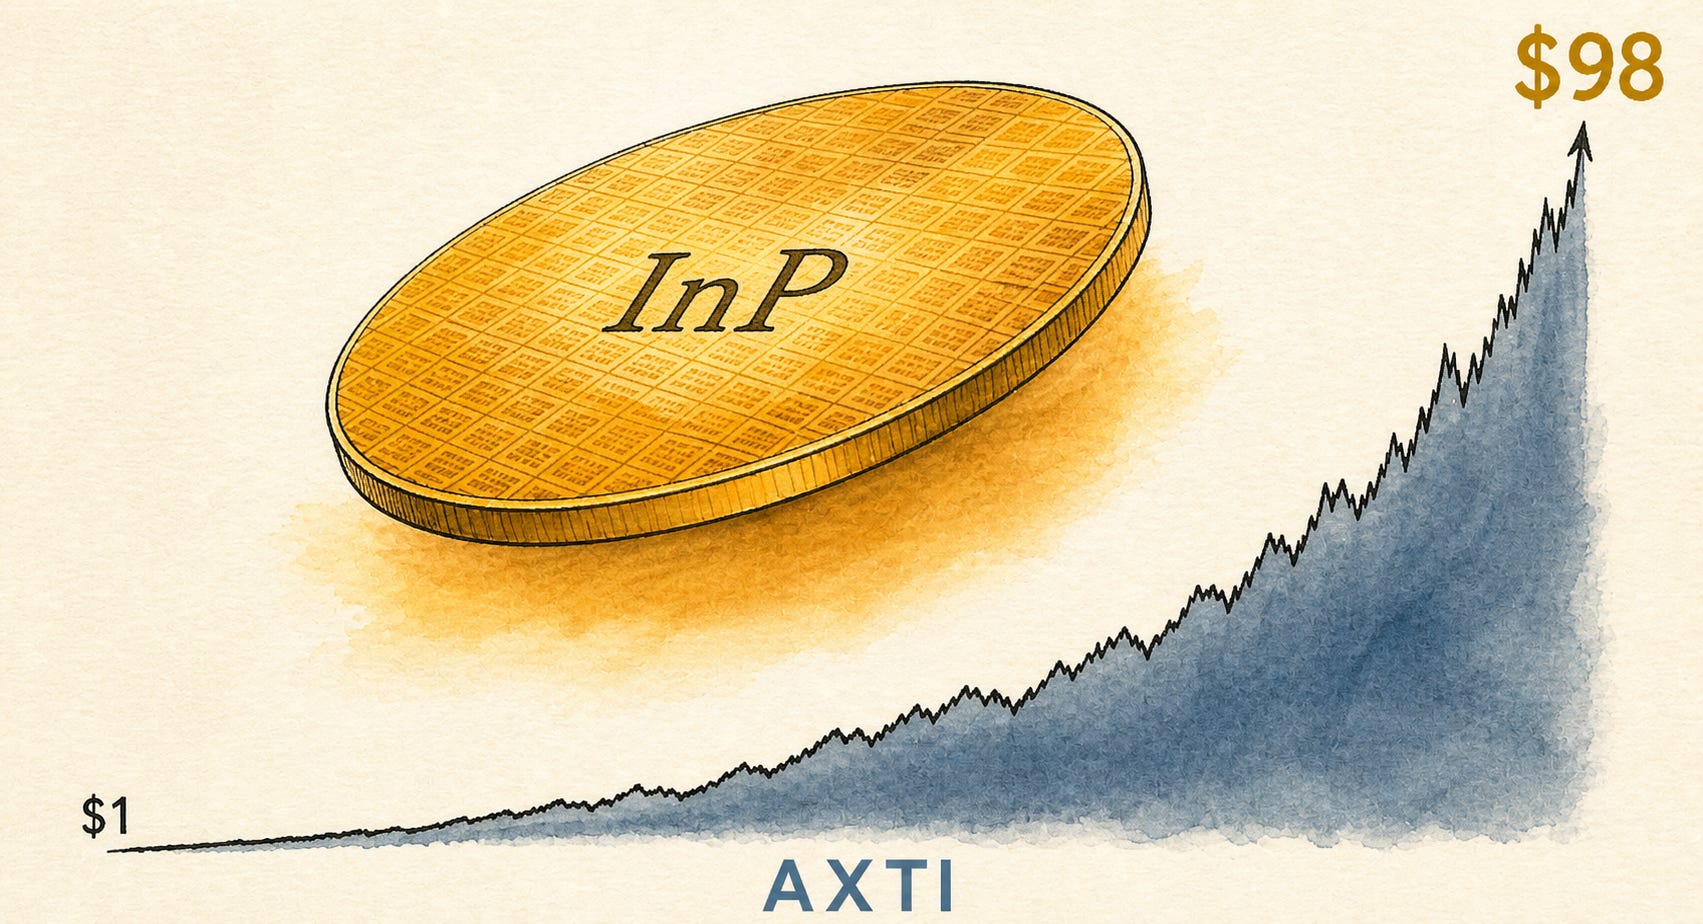
An InP substrate company with $88M in annual revenue and a $21M net loss is carrying a post-offering pro-forma market cap of over $6B (based on Q2 estimated diluted share count of approximately 63.5M at roughly $98 per share).[1][2]
AXT Inc. (AXTI) went from a 52-week low of $1.23 to $97.81.[2] That is a trailing 12-month return above 6,000%. Five months ago, the company raised capital at $12.25 per share. Last month, it raised again at $64.25.[3]
In the deep dive published on March 2, I analyzed the InP supply chain and AXTI’s vertically integrated model.[4] The stock was at $46.32 then, trading at a trailing P/S of roughly 28x. Two months later, the FY2025 trailing P/S has expanded to roughly 70x.
AXT Inc. (AXTI) Deep Dive: The Hidden Bottleneck in AI Optical Interconnects

1. The Hook: Why Pay Attention to Indium Phosphide (InP) and AXT Inc. Now?
This time, though, earnings started catching up to the narrative. The Q1 2026 results confirmed an InP revenue rebound, a margin inflection point, and backlog crossing $100M.[5][6] Management also guided for the company’s first ever profitable quarter in Q2.[6]
The narrative-to-earnings conversion has started. That is a fact. The question is whether $98 already prices in the final outcome of that conversion.
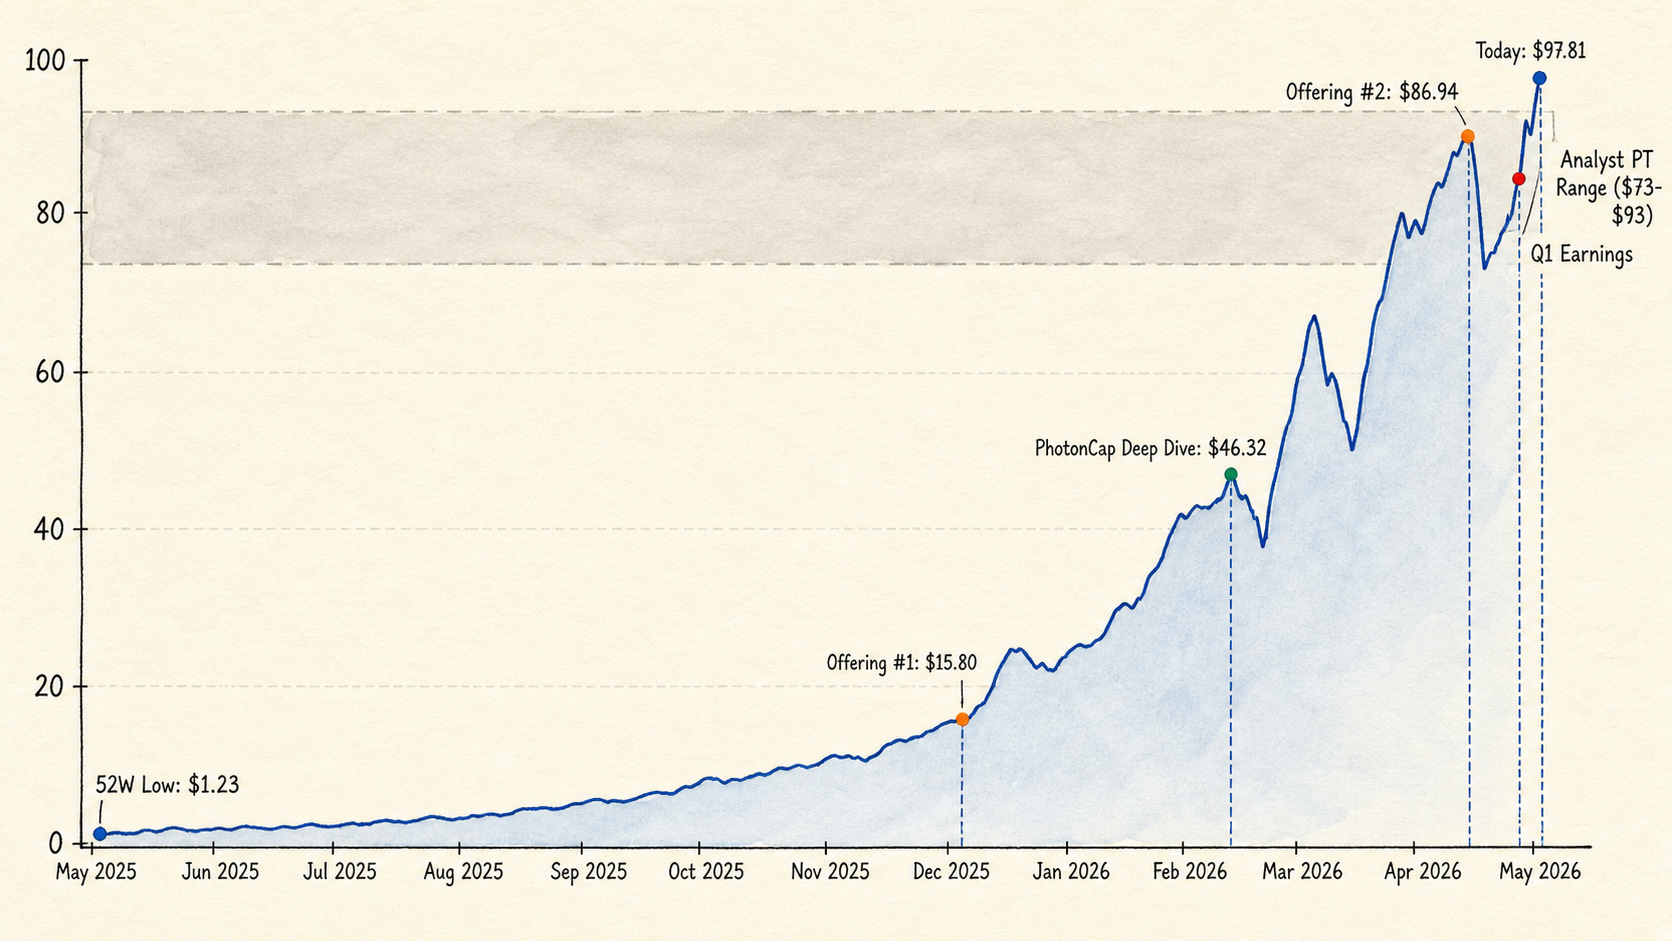
[Figure 1: AXTI Stock Price with Key Event Markers]
2. Q1 Results: The Margin Inflection and $100M Backlog
2.1 Revenue: InP Crossed 50% for the First Time
Q1 total revenue came in at $26.9M (per Q1 2026 SEC 8-K).[5] That is +17% QoQ and +39% YoY.
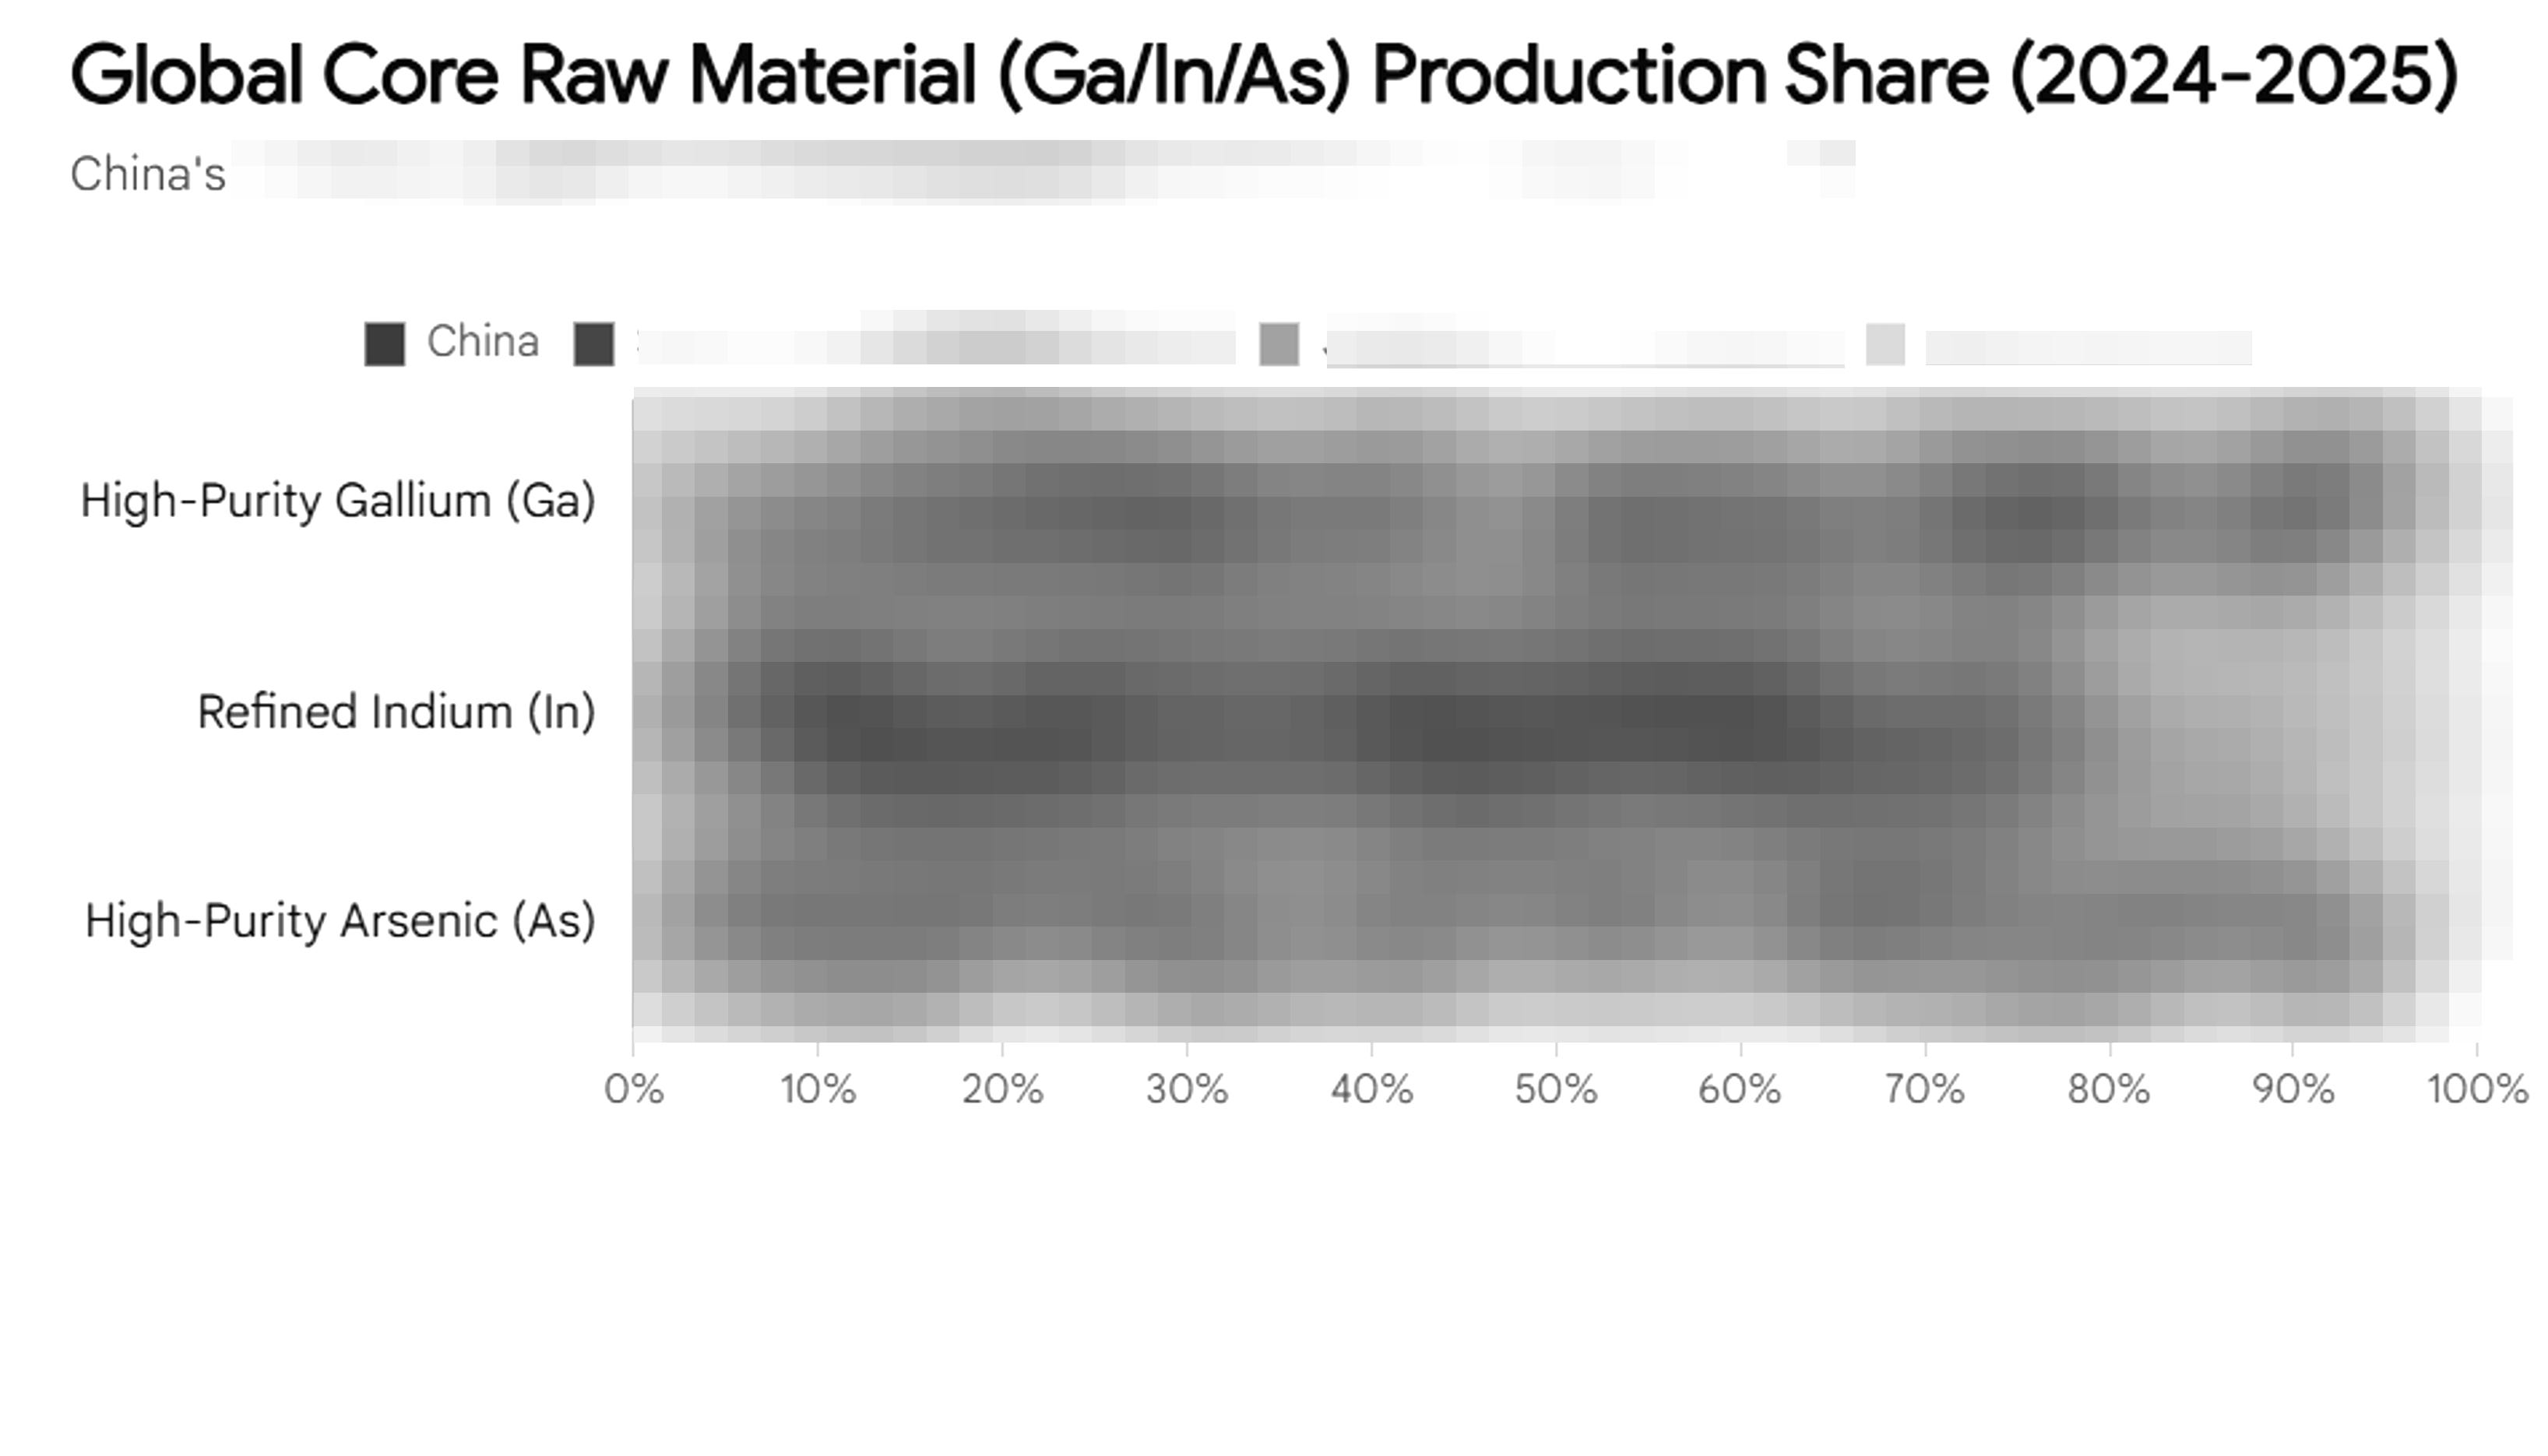
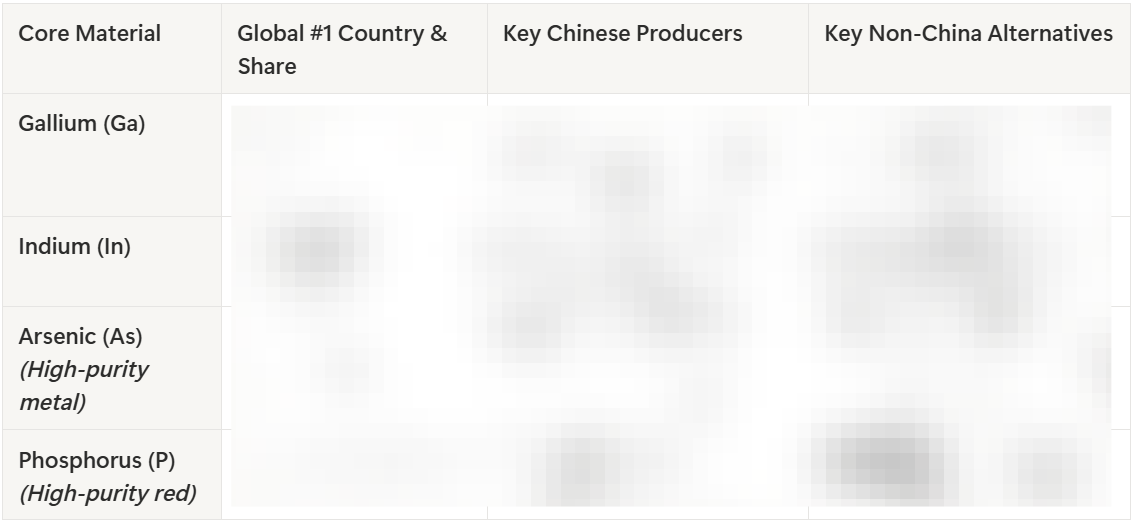
By product, InP hit $13.6M, rebounding 70% from $8.0M in Q4 and crossing 50.6% of total revenue for the first time.[5] GaAs was $5.4M (down 23% QoQ), Ge $0.2M (flat), and raw material JVs $7.6M (flat). The export permit bottleneck appears to have eased somewhat relative to Q4.
By geography, Asia Pacific accounted for 78%, Europe 21%, and North America 1%.[5] The 1% North America figure is consistent with U.S.-bound permit constraints not yet being fully resolved.
2.2 Margins: A 36 Percentage-Point Swing in One Year
The real story of this quarter is not the revenue number. It is margins.
Non-GAAP gross margin hit 29.9%.[5] In Q1 2025, that number was negative 6.4%. A 36 percentage-point swing. CFO Gary Fischer attributed this to fixed-cost absorption from higher InP volumes and the structurally higher margins that InP carries relative to GaAs.[6] With InP now above 50% of revenue, the overall margin profile has shifted structurally upward.
When a Wedbush analyst asked whether Q2 margins could reach 40%, Fischer drew the line: “too aggressive.”[6] Mid-term target is 35%, with 40%+ as a longer-term internal goal.
2.3 EPS and the Path to Profitability
GAAP EPS was negative $0.03 (versus consensus of negative $0.05, a roughly 40% beat). Non-GAAP EPS was negative $0.01 (versus consensus of negative $0.04 to $0.05, a 75 to 80% beat).[7][8] Compare that to negative $0.20 in Q1 2025 and negative $0.08 in Q4 2025. The trajectory is clear: negative $0.20, then negative $0.08, then negative $0.03. Q2 guidance calls for GAAP EPS of positive $0.05 to $0.07.[6]
2.4 Backlog Tops $100M, Q2 Guidance Points to First Profit
InP backlog crossed $100M, up 67% from $60M+ in the prior quarter.[6] Management indicated that long-term supply agreements (LTSAs) with tier-one laser manufacturers and hyperscalers could be signed “in the very near future.”[6]
Q2 guidance calls for revenue of at least $34M, InP revenue of $17M+ (a company record), non-GAAP gross margin above 30%, non-GAAP EPS of $0.06 to $0.08, and GAAP EPS of $0.05 to $0.07.[5][6] This would mark the company’s first ever profitable quarter on both a GAAP and non-GAAP basis.
Bottom line on Q1: record InP revenue, confirmed margin inflection, backlog above $100M, first profitable quarter guided for Q2. The demand-side bull case received its first validation from actual numbers.
3. Export Permits + China Domestic: The Structure Is Shifting
The export permit variable remains. But the structure around it is changing.
Q1 permit issuance came in slightly above guidance, and Q2 is off to a good start.[6] The key development is on U.S.-bound permits. Until now, direct shipments to U.S. customers have been effectively blocked (North America is 1% of revenue). MOFCOM has now requested additional documentation on pending U.S. applications.[6] VP Tim Bettles described this as “an encouraging sign.” It signals active review rather than outright rejection. Permits for non-U.S. international customers (including overseas facilities of American companies) continue to flow smoothly.[6]
At the same time, China domestic demand is accelerating rapidly. The prior quarter’s guide of “60%+ QoQ growth in China data center revenue” was exceeded. Actual Q1 growth was over 100% QoQ, and management expects another doubling in Q2.[6] Domestic China sales require no export permits. The “natural hedge” structure described in the original deep dive has started to function in practice.
Export permits are improving, and China domestic revenue is growing faster than expected, partially offsetting export control risk.
4. Demand Is Confirmed. But What About the Price?
That is the picture you can see from public information alone. The Q1 margin inflection and $100M backlog are facts. Whether a $6B market cap is a reasonable price for those facts is an entirely separate question.
The rest of this article addresses three things: what trailing P/S of 70x and run-rate P/S of 46x actually imply, the pattern of consecutive insider sales with zero purchases and 45% dilution, and what Q2 needs to deliver for $98 to hold.
So where, at this price, is the most favorable position in the value chain?